



The Bitcoin price traded near $81,000 on October 16 after rebounding from a weekly low of $79,800. BTC is testing its 50-day moving average for support. Trader Ardi identified $84,200 as the level needed to challenge the short-term bearish trend.
BTC price has struggled to extend its rebound above $80,000. Since September’s advance toward $87,000, recovery attempts have formed lower highs.
Why Is $84,200 Important for Bitcoin Price?
Crypto trader Ardi emphasized the chain of lower highs on an October 16 X post. He stated that buyers were yet to receive proof of the bullish reversal.
“Until we break above $84.2K, you have to respect that the local swing structure remains bearish,” Ardi said. A breakout would make him think of buying BTC near the top of the range.

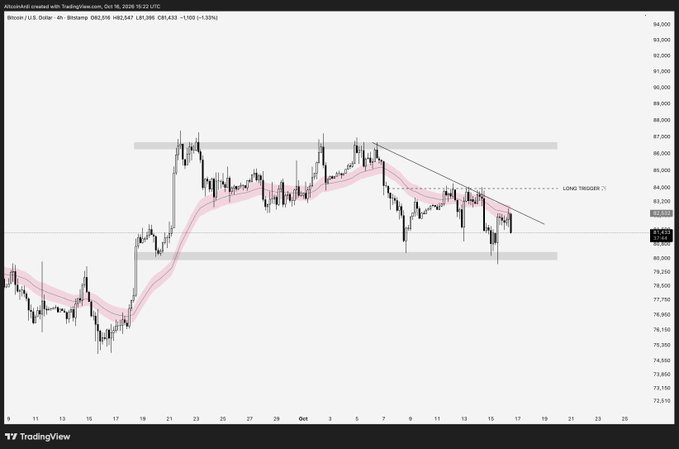
Prior to that, the Bitcoin price must rise to above $82,000. The latest daily high near $82,941 serves as the next hurdle prior to Ardi’s breakout level.
Also Read: Vitalik Buterin Unveils Great 3-Layer Private AI Stack
Analyst Jesse Olson remained cautious on October 16. In an X post, he said that the daily chart remained bearish with a chance for a new closing low.
What Do Bitcoin’s Moving Averages Show?
The Bitcoin price was trading near the 50-day moving average at $81,279. This indicator was about $67 away from the current price level and was up after the recovery started in August.
Maintaining the average price will help to sustain technical support nearby. Falling below it will shift focus to the low of $79,800 from last week.
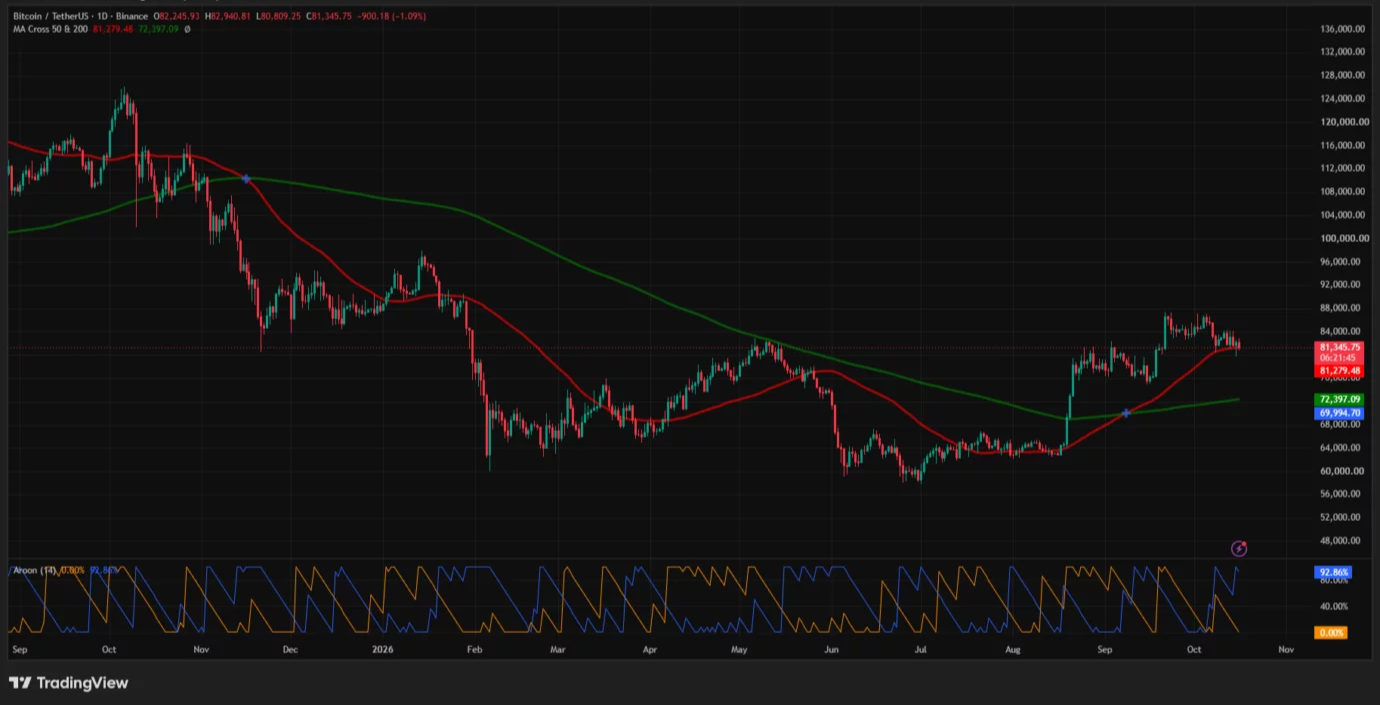
Daily Aroon readings supported the negative short-term sentiment for BTC/USD. The reading on the upside was 0%, while that on the downside touched 92.86%. It is because the current low was more recent compared to a high on the 14-bar window.
In addition, the 200-day moving average of the Bitcoin price was seen at $72,397. The shorter period MA was seen higher relative to the longer period indicator after their bullish cross.
Thus, the Bitcoin price saw a test at the faster moving average and not the slower 200-day average. Falling below $80,000 will signal a weakening in the recovery trend.
Can Weekly Indicators Support a Recovery?
However, the weekly relative strength index had another value: 56.39, above 50, with the average value equal to 51.80.
This value indicated that weekly momentum was strong even though daily momentum was poor. Nevertheless, RSI still had values below those of previous rises.
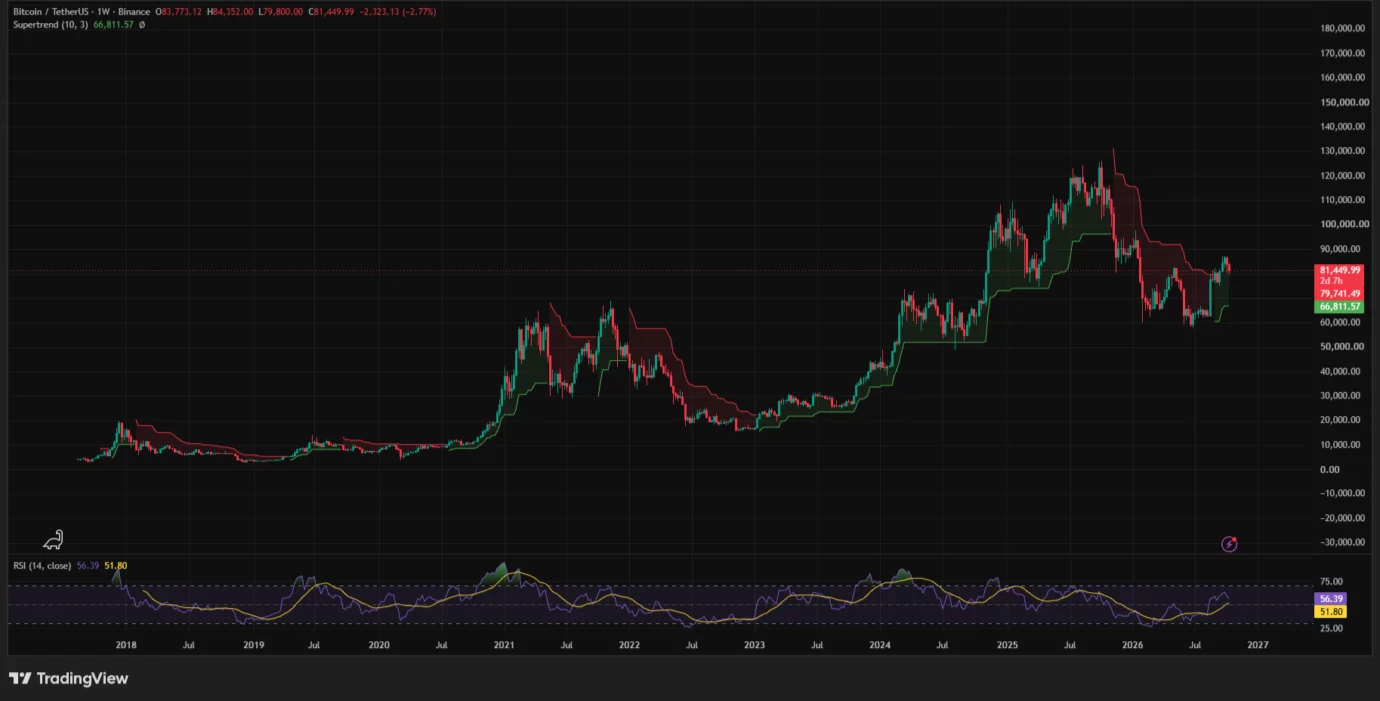
The weekly Supertrend was also green, at around $66,812. The Bitcoin price was much higher than this level, which meant that the overall indicator remained positive during the daily correction period.
Where Are the Main Liquidation Levels?
One-week heatmap from CoinGlass depicted a high overhead concentration level between $84,300 and $84,700, with a smaller estimated concentration between $83,300 and $83,700.
These areas are higher than the current Bitcoin price and are near Ardi’s breakout level. If a move is made towards the upper clusters, shorts can be closed out, but the heatmap doesn’t indicate the direction.
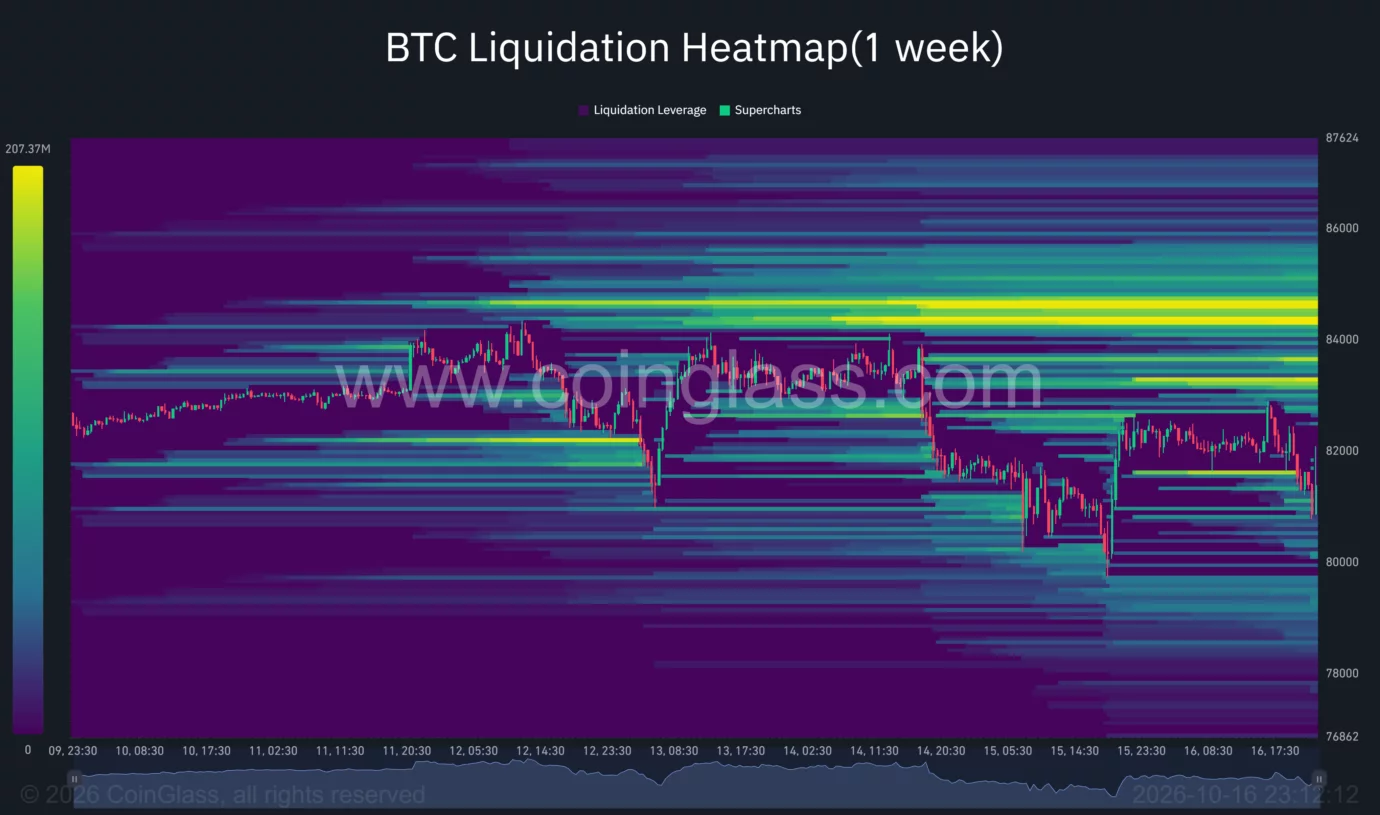
Beneath the price action, there were two concentration levels at $80,000 and at $79,000–$79,500. If the market moves under the weekly lows, the lower cluster will be seen.
The latest US inflation numbers added yet another risk for the markets. According to the Bureau of Labor Statistics, the Consumer Price Index increased by 3.7% annually in September from 3.4% the previous month.
Also Read: Strive Buys 2,822 Bitcoin for $235M as Holdings Reach 35,595 BTC
This article contains market analysis and price predictions. These are not guarantees. Crypto markets are volatile. Always DYOR. Not financial advice.


Be the first to comment