



The market continues to view Bitcoin’s current move as nothing more than a relief rally.
From a technical perspective, BTC has rallied more than 10% so far in Q3, but a real breakout still looks far-fetched unless Bitcoin clears the $73k resistance. Until then, BTC risks repeating the late-Q2 setup, when bulls failed to hold the $75k-$80k support zone.
That led to a more than 20% pullback in June, marking the second major instance of bulls failing to defend support since Bitcoin’s $126k peak.
If a similar setup plays out again, BTC’s $65k level could come under pressure for another sell-off. Some market participants are already pricing in the possibility of Bitcoin forming a third lower low by early Q4, while a few are even calling for a move toward $40k.

That scenario can’t be ignored, especially with the analyst behind these calls claiming a 100% hit rate on previous Bitcoin predictions.
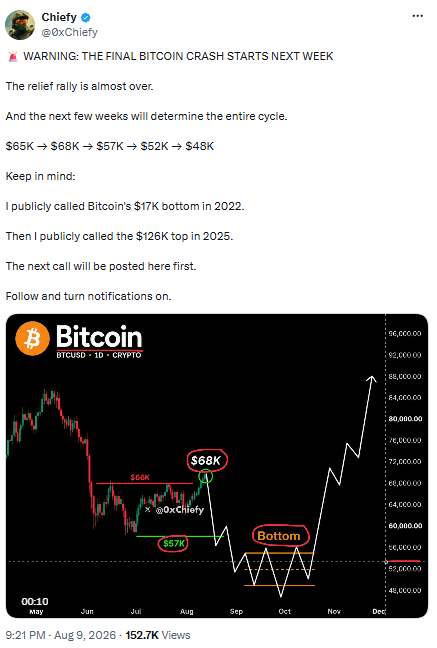

In short, the market is still skeptical that Bitcoin [BTC] has found a bottom.
But the derivatives market isn’t really following that playbook. According to CoinGlass data, BTC’s Long/Short Ratio has jumped to a multi-year high of 1.81, suggesting traders are leaning heavily bullish despite the uncertainty around BTC’s price structure.
That puts these heavily leveraged longs at risk of a sharp unwind if BTC follows the broader market’s bearish Q3 expectations. At the same time, Bitcoin’s liquidation heatmap shows short leverage building up too, with more than $30 million stacked around the $65.8k level alone.
Against this backdrop, Michael Saylor’s latest buy signal doesn’t look like a fluke.
Can Saylor’s buy signal trigger a Bitcoin bear trap?
Michael Saylor’s post came at a pivotal time.
Bitcoin’s liquidation heatmap shows leverage building up, while BTC has traded around the $65k level for more than 12 weeks. Perpetual traders now watch closely for the next major move.
Given the weak technical setup discussed above, a short-side bet makes sense, which explains why short liquidity is building, with around $30 million stacked near key levels. But long liquidity isn’t far behind.
According to the liquidation heatmap, more than $36 million in long liquidity is stacked around $64,555, making it a clear short-term target if bears take control.
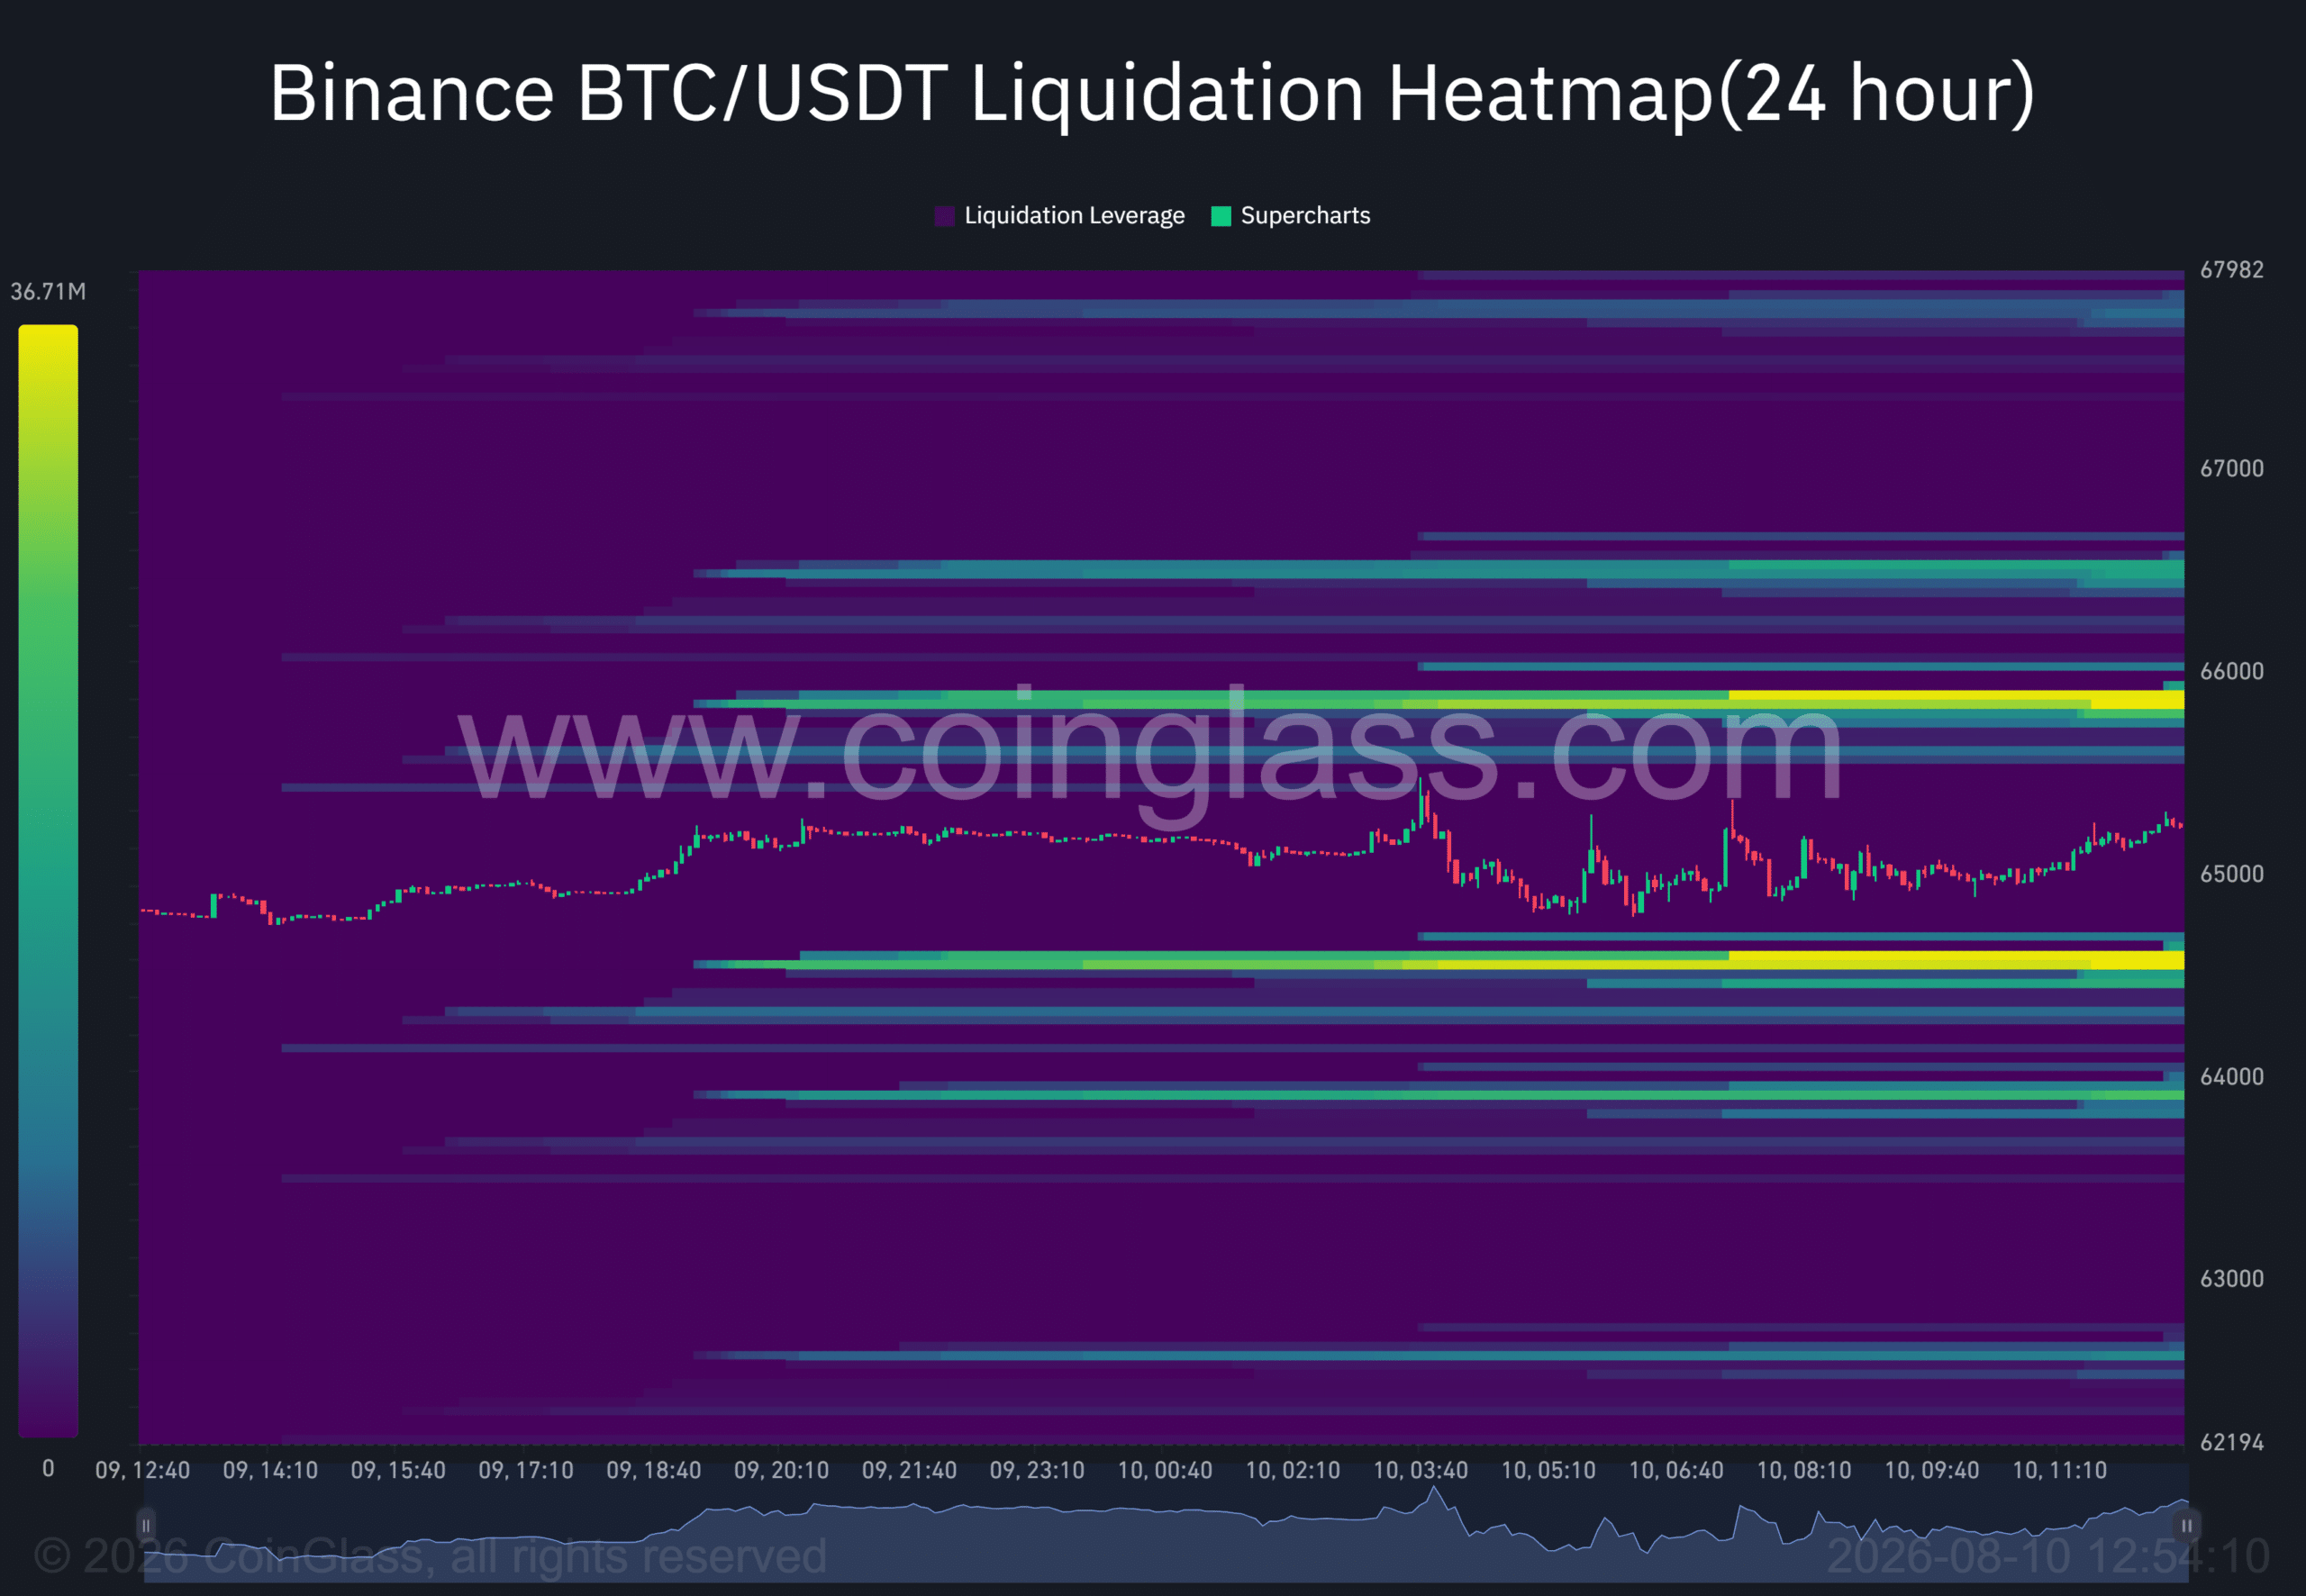

Against this backdrop, Saylor’s latest Bitcoin buy signal is coming at an interesting time, especially with ETF flows staying strong. Bitcoin ETFs recorded more than $870 million in net inflows last week, marking their strongest weekly inflow since April.
In simple terms, it looks like Michael Saylor could be strategically positioning around these short liquidity clusters, potentially helping trigger a short squeeze and push BTC toward the $66k range.
But this is where ETF flows start to matter more. If the inflow trend continues, it could turn a short squeeze into a broader trend reversal, forcing Bitcoin higher against the growing bearish bets in the market.
That would also keep a move back toward the $75k range before the end of Q3 firmly on the table.



Be the first to comment