



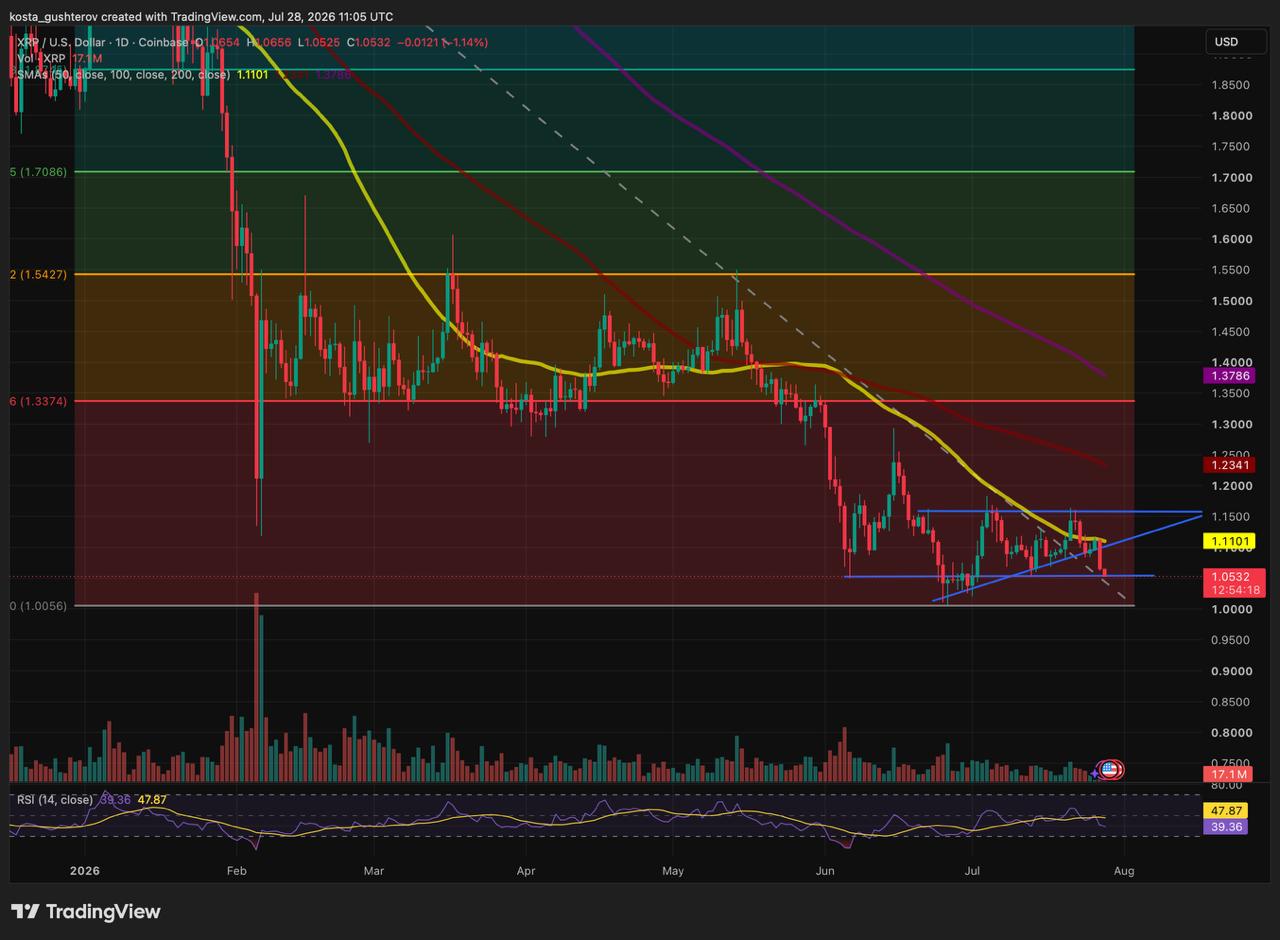
XRP’s rising trendline held briefly during previous sessions, but buyers could not build on the defence. Price has since broken below it and fallen towards $1.05 at the time of writing.
Key Takeaways
- XRP has broken below its rising trendline.
- Price is testing support around $1.05.
- Spot and futures traders reduced exposure.
- Losing $1.05 could expose $1.01.
- The broken trendline now blocks recovery.
The move confirms the downside risk discussed in our previous XRP analysis. The first bounce lacked enough demand to move price away from support, leaving the structure vulnerable when selling returned. placing it directly on another important area.
XRP Has Returned to a Key June Support
The $1.05 zone combines the early-June low with the range where XRP traded repeatedly between June 24 and June 30. That history makes it the clearest nearby area where buyers may try to slow the decline.
A sustained break below it would expose the June 26 bottom near $1.01. That level marked the base of the recovery that later developed into the rising triangle.
Spot and Futures Traders Are Pulling Back
Coinglass data shows that capital left both XRP spot and futures markets as the trendline failed.
Spot trading recorded a 12-hour net outflow of approximately $2.54 million, while futures posted a much larger net outflow of $24.02 million. The four- and eight-hour readings were also negative in both markets.
The combination matters. Spot buyers were not absorbing enough supply to defend the chart, while derivatives traders were reducing leveraged exposure rather than positioning for an immediate rebound.
The futures withdrawal was far larger, suggesting that much of the reaction came from traders cutting risk as support gave way. That can reduce future liquidation pressure, but it does not repair the chart without renewed spot demand.
The Broken Trendline Is Now Resistance
XRP must first recover the former triangle support before the short-term structure can improve. The rising line now sits close to the 50-day simple moving average near $1.1101, creating a difficult resistance area.
A move back above both levels would show that the breakdown failed and return XRP to its previous range. Until then, rebounds towards that area may attract sellers.
The wider risk-off mood ahead of rate decisions from the Federal Reserve and the Bank of Japan. A change in Japanese rates could force investors to unwind yen-funded carry trades, positions built by borrowing cheaply in Japan to buy higher-yielding assets, which can trigger selling across crypto. Even so, XRP’s immediate weakness might be best explained by its broken chart structure and the outflows from its spot and futures markets.
Holding $1.05 could produce a relief bounce, but XRP would remain technically weak beneath the broken trendline and 50-day SMA.
A daily close below the current support would bring $1.01 into focus. A recovery above the former triangle boundary would be the first sign that buyers are beginning to repair the breakdown.
- Disclaimer: This article is for informational and analytical purposes only and does not constitute financial or investment advice. Technical levels and market-flow data do not guarantee future price movements.
- Methodology: XRP price levels and technical structure are based on the XRP/USD daily chart from TradingView using Coinbase data. Spot and futures flow figures come from Coinglass.

Kosta has reported on cryptocurrency markets and blockchain infrastructure since 2020, bringing over six years of hands-on experience in the crypto industry built through daily tracking of markets, trends, and emerging blockchain developments. Specializing in Bitcoin on-chain analysis, institutional ETF flows, and digital asset price action, his work at Coindoo has been cited by other news agencies and consistently covers market developments with a focus on data-driven reporting across Bitcoin, Ethereum, Solana, and XRP.
Over the years, Kosta has contributed to multiple crypto media outlets in different regions, authoring over 6,000 articles across the sector. His reporting spans cryptocurrency markets and the broader fintech industry, tracking not only price action but also the technological and regulatory forces shaping the ecosystem.
To support his analysis, Kosta actively leverages on-chain data and metrics from leading platforms such as Santiment, Glassnode, and CryptoQuant, enabling deeper, evidence-based market insights. He believes in the power of transparency and the data that underpins the blockchain ecosystem.
His academic background in Marketing Management from Denmark further complements his analytical approach, adding a strong understanding of communication strategy and content positioning to his work.



Be the first to comment