



What to know:
- CRV forms an inverse head-and-shoulders pattern as buyers attempt a bullish reversal.
- A clear breakout above $0.214 could push CRV toward $0.220 before resistance at $0.2326.
- RSI stays neutral at 50.07, while the negative MACD signals limited bearish momentum.
The CRV price on Thursday, July 30, 2026, showed recovery signs as an inverse head-and-shoulders pattern developed. A neckline breakout could strengthen bullish momentum, while resistance levels and derivatives activity remained important for its next move.
As of writing, Curve Dao (CRV) is currently trading at $0.2095, showing an increase of 0.19% in a day. The 24-hour trading volume stands at $28.6 million, with a market capitalization of $321.88 million. Over the last week, the token has lost 0.73%, according to CoinMarketCap.
Also Read: Cardano Price Prediction: ADA Price Accumulation and ETF Inflows Fuel Breakout Hopes

CRV Price Breakout Hinges on $0.214 Neckline
Analyst Crypto With Gopal pointed out an inverse head and shoulders formation on the CRV one-hour chart. The analyst noted that buyers created a higher low following the pattern’s head. The formation was attributed to bearish momentum weakening and accumulation.
The neckline is located between $0.212 and $0.214. A clear breakout will signal the formation of a reversal and push the CRV price above $0.220. A stronger volume is expected to improve the possibility of the breakout, according to the analyst.
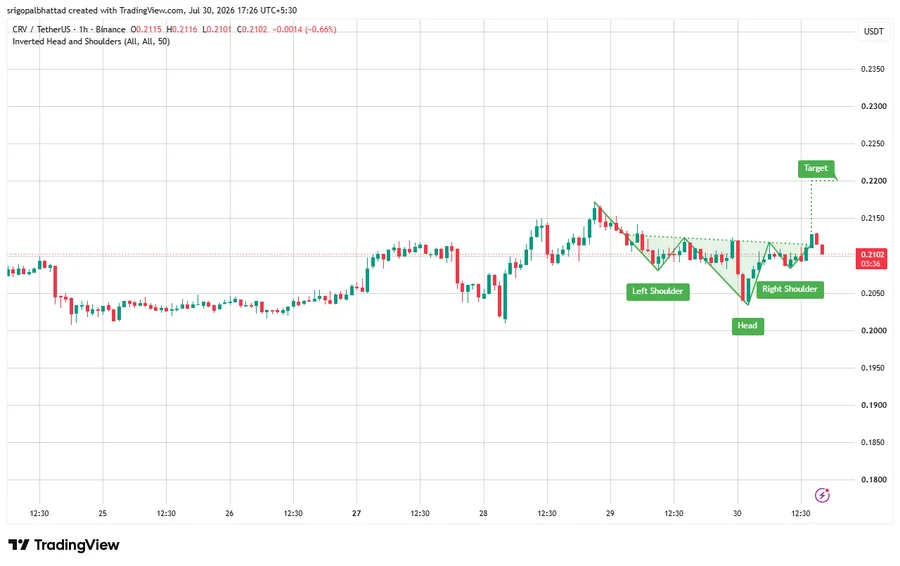
The right shoulder is important for the bullish setup. Maintaining the price above the right shoulder will preserve the setup. Nevertheless, a successful neckline break will be necessary for the reversal to be valid.
According to CoinLore, the recent short-term support is at $0.1810. It identified $0.2326 as the first resistance based on recent CRV price action. The price level is above the analyst’s neckline and the $0.220 target.
A breakout from the current price level beyond $0.2326 will put $0.2902 in focus. CoinLore listed that figure as the second resistance level. Third resistance comes at a higher level of $0.3457.
Volume and Open Interest Move Lower
According to CoinGlass data, the futures volume dropped 4.59% to $40.80 million. Open interest fell by 0.12% to $60.97 million also. Both measures recorded lower activity.
Meanwhile, the OI-weighted funding rate stayed in positive territory at 0.0035%. Futures volume and open interest decline, while funding remains above zero.
What RSI and MACD Signals for CRV Price
According to TradingView, on the daily chart, the CRV 14-day RSI measured 50.07. Its moving average stood at 49.68. This placed CRV price momentum slightly above the neutral level.
The RSI exceeded its average by 0.39 points. It also remained between the oversold threshold of 30 and the overbought level of 70. The readings showed balanced market conditions.
The daily MACD readings remained close to zero. The MACD line stood at -0.0003, while the signal line is effectively zero at -0.0000. The histogram has also registered -0.0003.
The MACD line remained below the signal line. The negative histogram showed that a bullish crossover had not occurred. However, the small gap indicated limited bearish momentum.
The $0.212–$0.214 neckline remains the immediate technical test. A decisive breakout would strengthen the analyst’s reversal case.
Also Read: Meta Stock Plunges 9% as Massive AI Spending Shakes Investors
This article contains market analysis and price predictions. These are not guarantees. Crypto markets are volatile. Always DYOR. Not financial advice.


Be the first to comment