


Bitcoin price fell below $77,000 as traders reduced risk before a key U.S. Senate vote on the CLARITY Act, while technical charts showed weakening short-term momentum.
Summary
- Bitcoin price traded near $77,000 after falling as low as $76,704 on Binance.
- The 4-hour RSI dropped to 44.20, putting momentum below the neutral level.
- Liquidation clusters were concentrated near $76,000, $78,400, and $80,000.
- Analysts identified $75,500–$76,000 as the main short-term support area.
Bitcoin price action today
According to data from crypto.news, Bitcoin (BTC) price traded at about $77,059 at the time of writing, down 1.45% on the daily candle. The cryptocurrency opened at $78,189, reached an intraday high of $78,250, and dropped to $76,704 before recovering slightly.

The decline followed another failed attempt to hold the $79,000 area. Bitcoin has recorded lower highs since reaching roughly $82,000 in early September, while buyers have repeatedly defended the region between $76,500 and $77,000.
Bitcoin also fell below the middle line of its 4-hour Bollinger Bands, which stood at $77,474. The move left BTC closer to the lower band at $76,359 than the upper band at $78,589, showing that sellers retained control of the short-term range.
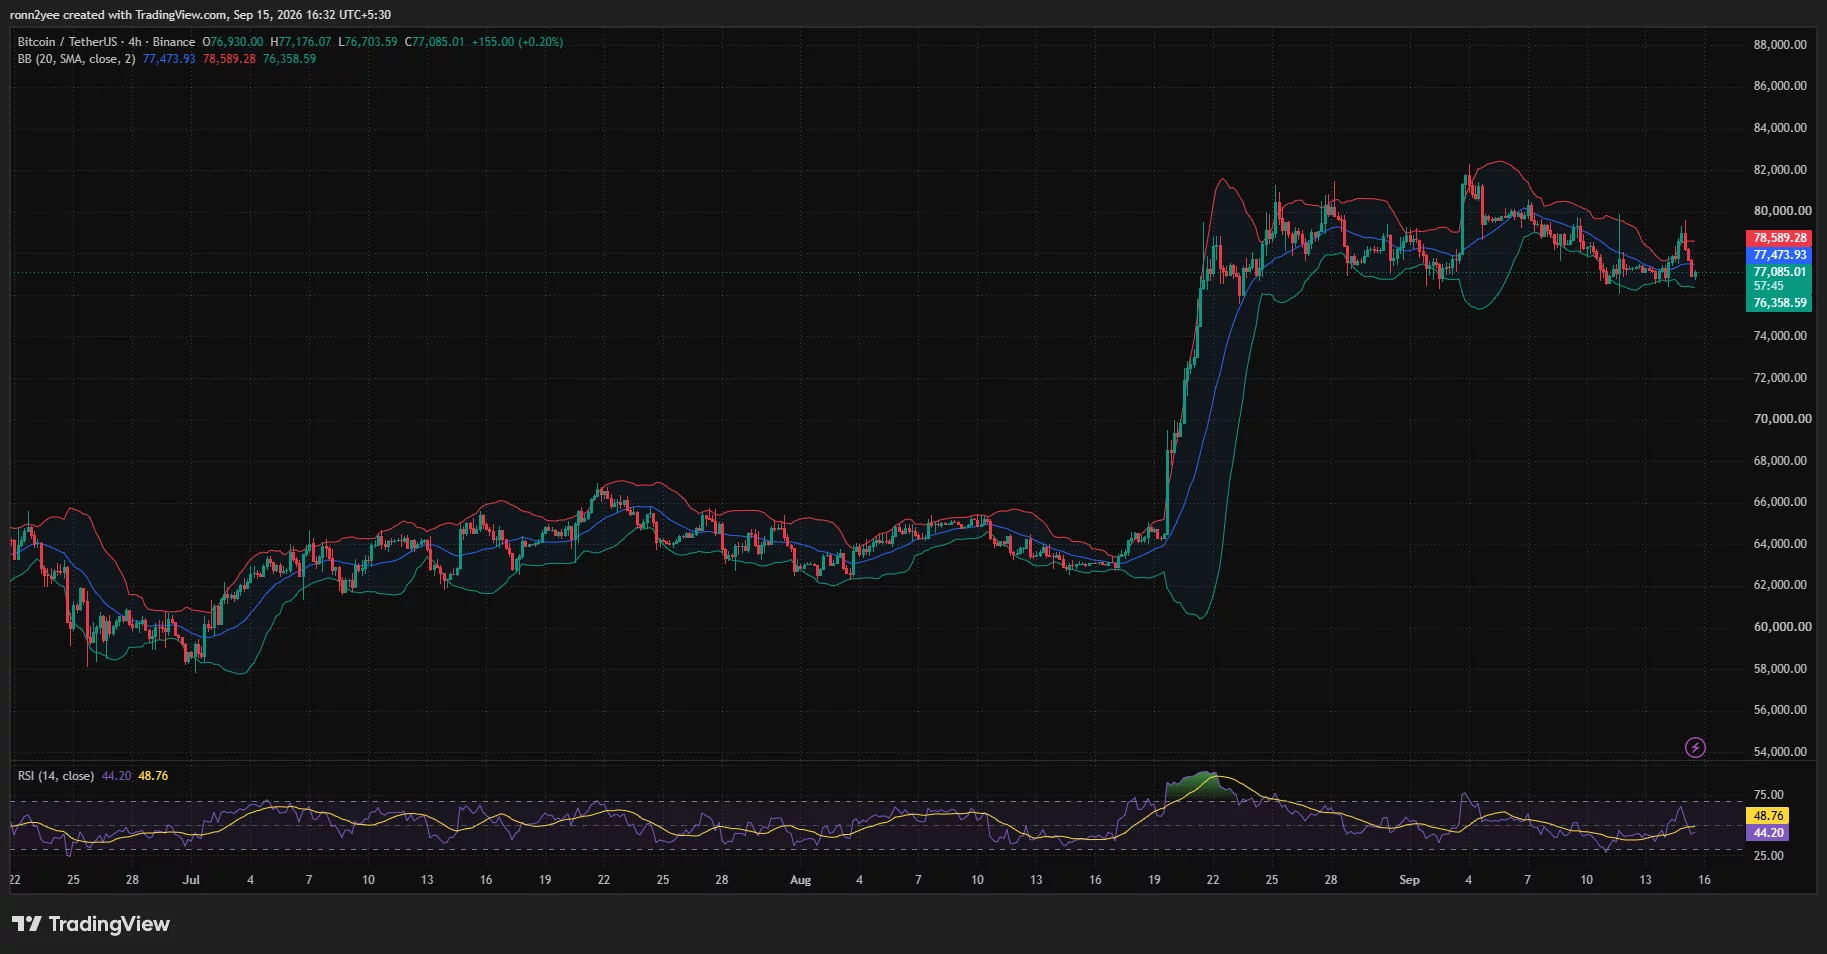
The 4-hour relative strength index stood at 44.20, below its signal line at 48.76. Although the indicator had not reached oversold territory, its position below 50 showed that bullish momentum had weakened.
CLARITY Act vote adds to market pressure
Uncertainty surrounding the Digital Asset Market Clarity Act contributed to the cautious trading conditions. The U.S. Senate was preparing for a cloture vote that would require 60 votes to open debate on the market-structure bill.
Traders had previously responded positively to reports of a revised draft. Doubts about whether the legislation could reach the required threshold later reduced that optimism.
The bill remains important for U.S. investors because it seeks to clarify how federal agencies oversee digital assets. Failure to advance the measure could delay broader market-structure legislation and leave parts of the U.S. crypto industry operating under the existing regulatory framework.
Macro conditions also remained a risk for Bitcoin. Hotter August inflation data and rising oil prices are factors behind stronger expectations for restrictive Federal Reserve policy.
Higher interest rates can weigh on cryptocurrencies by increasing the returns available from Treasury securities and other yield-bearing assets. The next Fed decision could therefore affect whether Bitcoin holds its current support or extends the decline.
Bitcoin liquidity builds around $76K and $78.4K
CoinGlass’ 24-hour liquidation heatmap showed Bitcoin falling steadily from nearly $79,400 before stabilizing around $76,600.
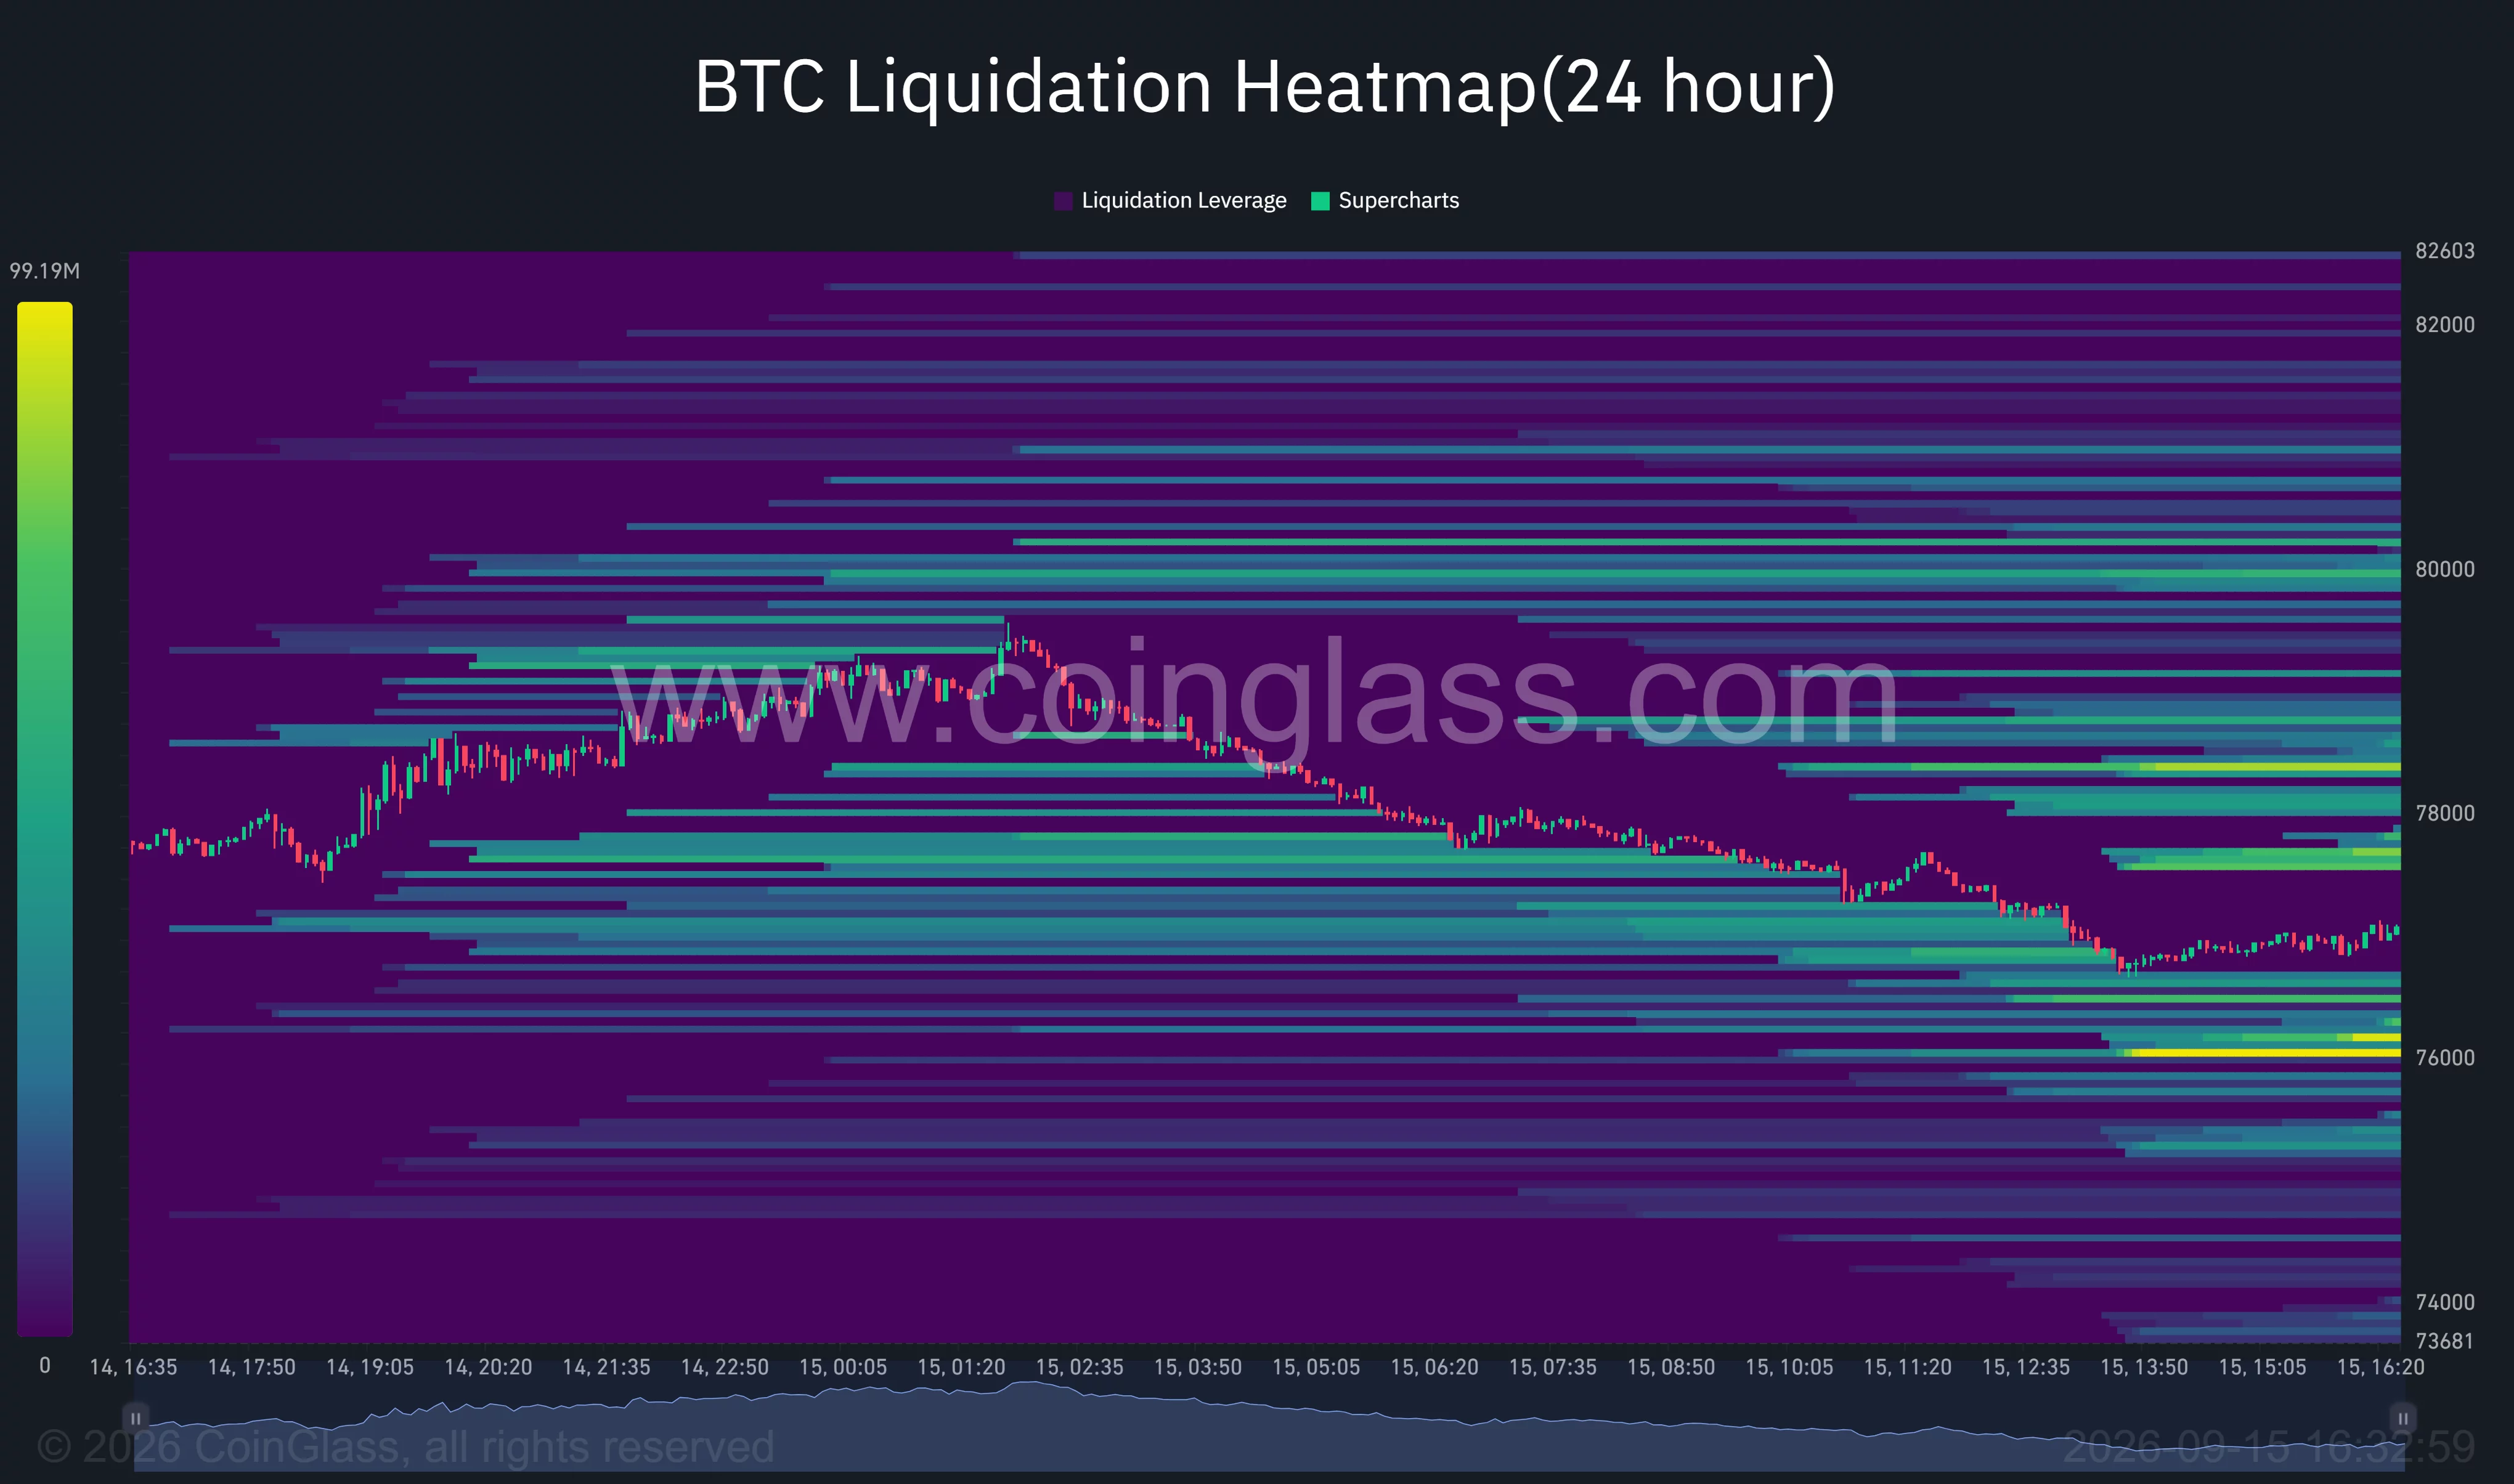
One of the strongest liquidity concentrations below the market appeared near $76,000. Additional liquidity was visible around $75,000, making the $75,000–$76,000 region a possible target if sellers force another move lower.
The heatmap also showed large pools above the current price. The nearest major concentration sat around $78,300–$78,500, followed by another broad cluster near $80,000.
Those levels could attract price if Bitcoin recovers, but they may also act as resistance because traders caught in losing positions could close exposure as the market approaches their entry levels.
A sustained break above $78,600, corresponding with the upper 4-hour Bollinger Band, would improve the short-term setup. Bitcoin would then need to reclaim $80,000 before testing the September highs near $82,000.
Key Bitcoin support remains near $75,500
The daily chart showed Bitcoin trading above its Supertrend support at $72,786 despite the latest pullback. The indicator’s green reading means the broader daily recovery from the August range remains intact unless the price falls below that level.
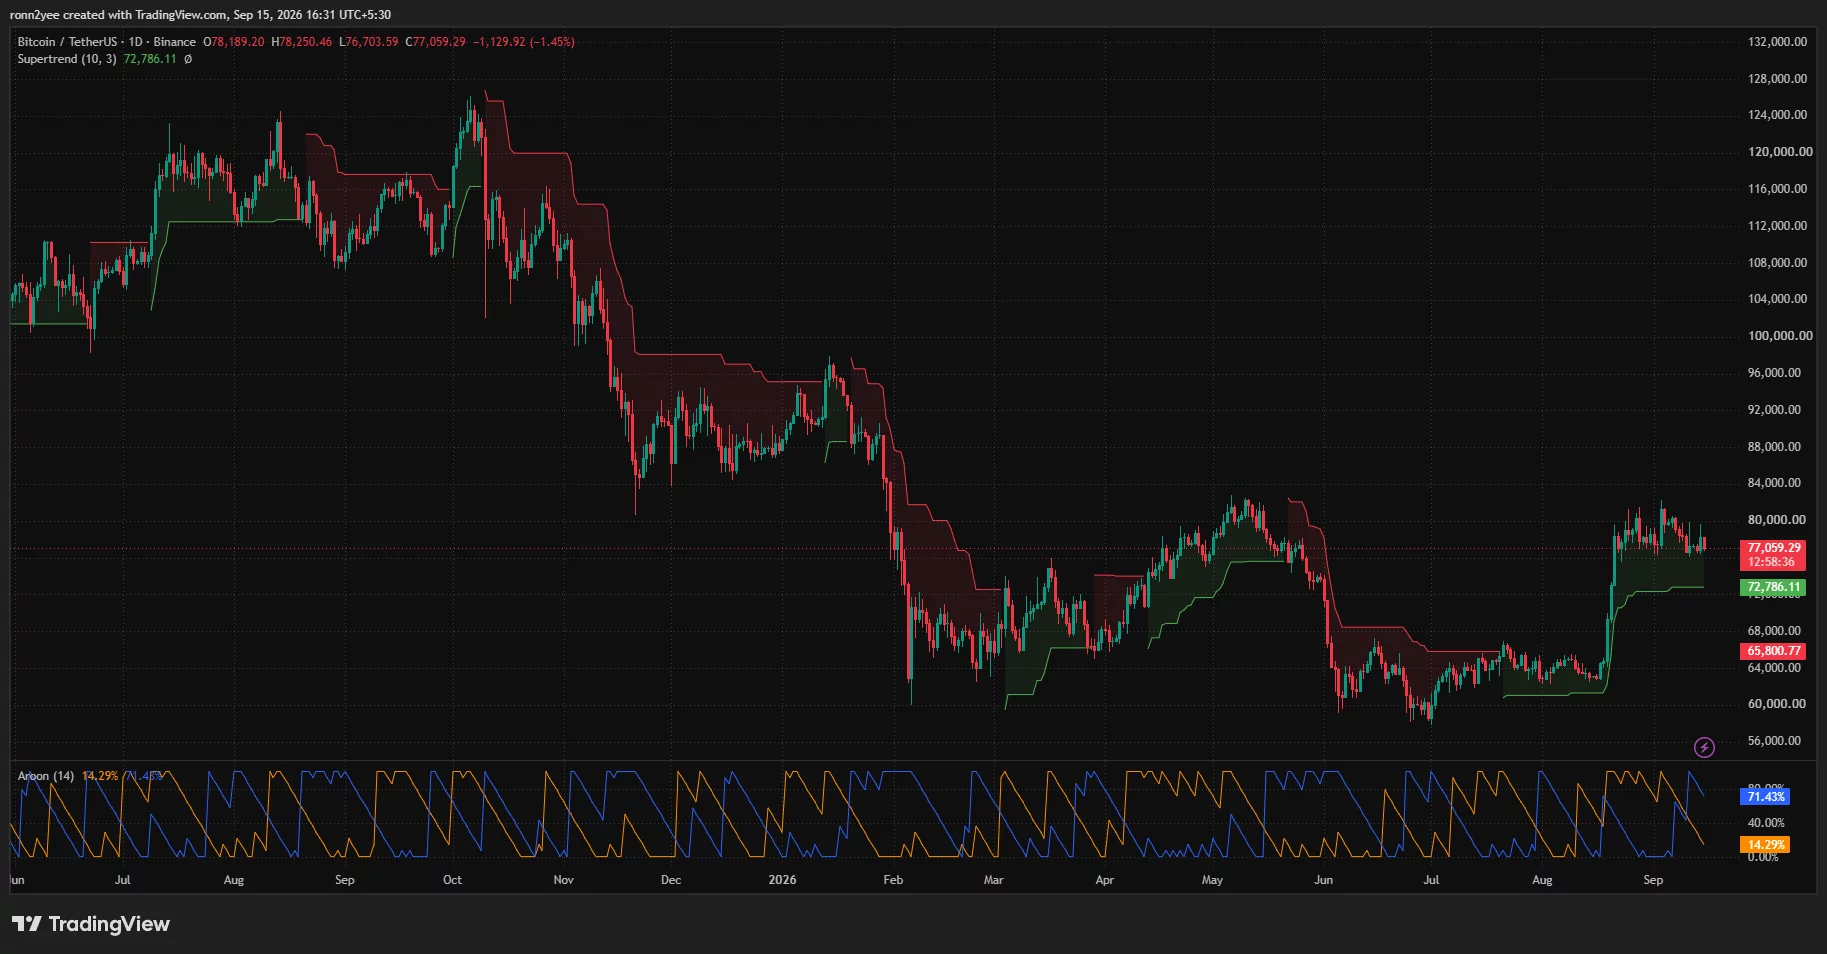
Shorter-term support is considerably closer. The recent low around $76,700 and the lower Bollinger Band at $76,359 form the first defense area, followed by the liquidation concentration near $76,000.
Trader Lennaert Snyder said he entered a short position after Bitcoin was rejected near $79,000 and closed the trade when BTC reached his $77,300 target.
Snyder identified $76,000 and $75,500 as the main levels for a possible rebound. He said a brief move below $75,500 around the CLARITY Act vote could create a long setup if Bitcoin quickly recovers with strong buying pressure.
A daily close below $75,500 would weaken that rebound scenario and expose lower support. The daily Supertrend at approximately $72,800 would then become the next important technical level.
Analysts warn about the 50-week EMA
Crypto analyst Ted Pillows said Bitcoin had moved back below its 50-week exponential moving average. According to Pillows, BTC also closed below the indicator in the previous week, and another weekly close beneath it could accelerate the existing downtrend.
The chart shared by Pillows placed the 50-week EMA near $78,300, making the $78,300–$78,600 range an important recovery zone. Bitcoin would need to reclaim that area to reduce the immediate risk of another rejection.
The technical and liquidation charts leave BTC between clearly defined levels. A rebound above $78,600 could open a move toward $80,000, where the heatmap showed heavy liquidity. A confirmed loss of $75,500 would instead raise the risk of a decline toward $72,800.
Disclosure: This article does not represent investment advice. The content and materials featured on this page are for educational purposes only.



Be the first to comment