



Bitcoin price is once again under pressure from sellers following its decline from the $87,000 zone, although a technical signal indicated by cryptocurrency expert Ali Charts indicate that the correction is close to coming to an end. According to Ali Charts, the TD Sequential indicator is giving a buying signal for Bitcoin.
BTC is currently trading around the $82,083 level, experiencing a drop of nearly 1.5% from the last close. Bitcoin has traded from a high of $83,616 to a low of $81,792 and the $82,000 area continues to remain a focus zone for the traders.
It should be noted that the current technical signal is appearing amid mixed market signals for Bitcoin. Although the price action has been bearish in the recent period.
What Happened With Bitcoin Price?
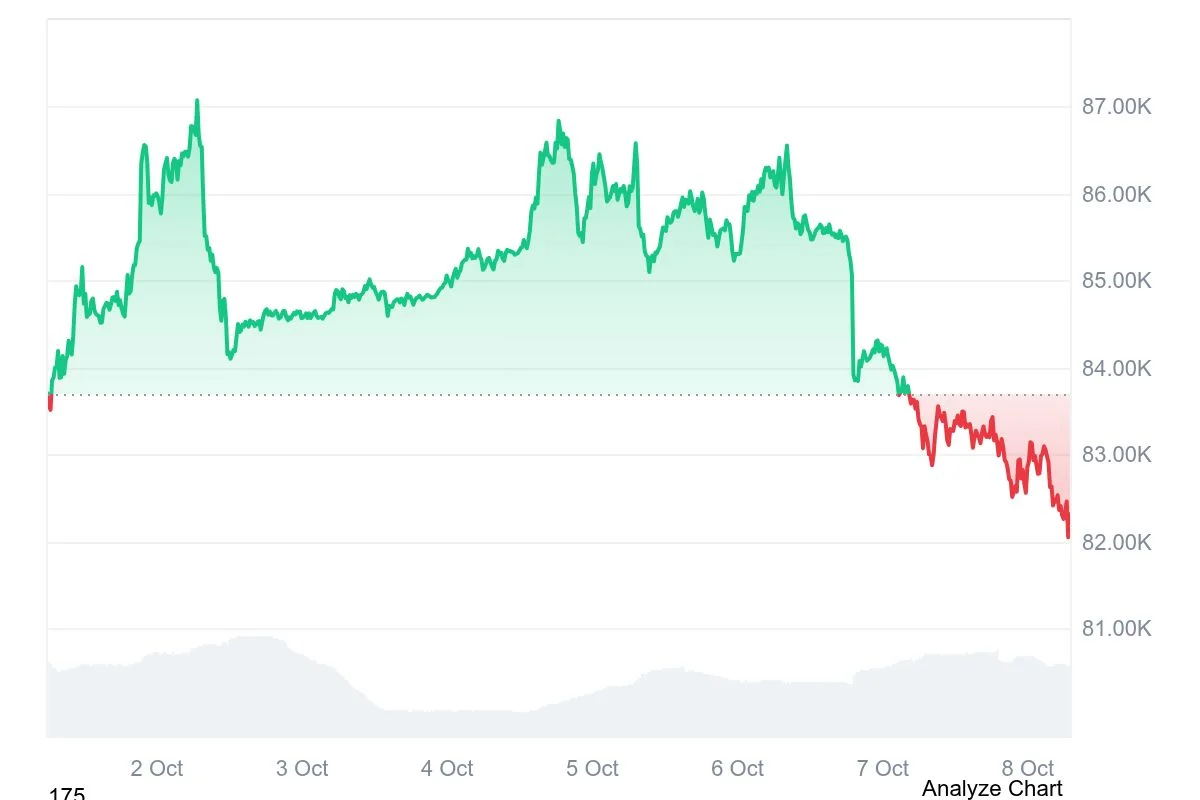
Bitcoin was moving up strongly at the start of October but was taken over by sellers in the $87,000 area. Bitcoin touched a high of $86,995 on October 5 before reversing down.

The trend remained downward for subsequent trading periods, with Bitcoin dropping to $85,557 on October 6 and $83,276 on October 7. The most recent drop has seen Bitcoin move towards the $82,000 level.
Source: CoinMarketcap
The decline has also occurred against a weaker backdrop for risk assets. Bitcoin fell alongside broader pressure across cryptocurrencies as investors monitored Treasury yields, oil prices and the wider macroeconomic environment.
With BTC now close to its recent lows, traders are watching whether the market can establish support or whether the selling pressure will continue.
Also Read: Bitcoin ETF Outflows: $168M Bearish, Massive $241M Net
Why Is Ali Charts Watching the TD Sequential?
Crypto analyst Ali Charts highlighted the TD Sequential buy signal on Bitcoin’s four-hour chart after the latest decline.
The signal is important because it appears after a relatively sharp 5.55% correction from the October 5 high. The TD Sequential is designed to identify potential exhaustion in a trend, meaning the latest reading could indicate that Bitcoin’s current selling sequence is approaching a point where a rebound becomes possible.
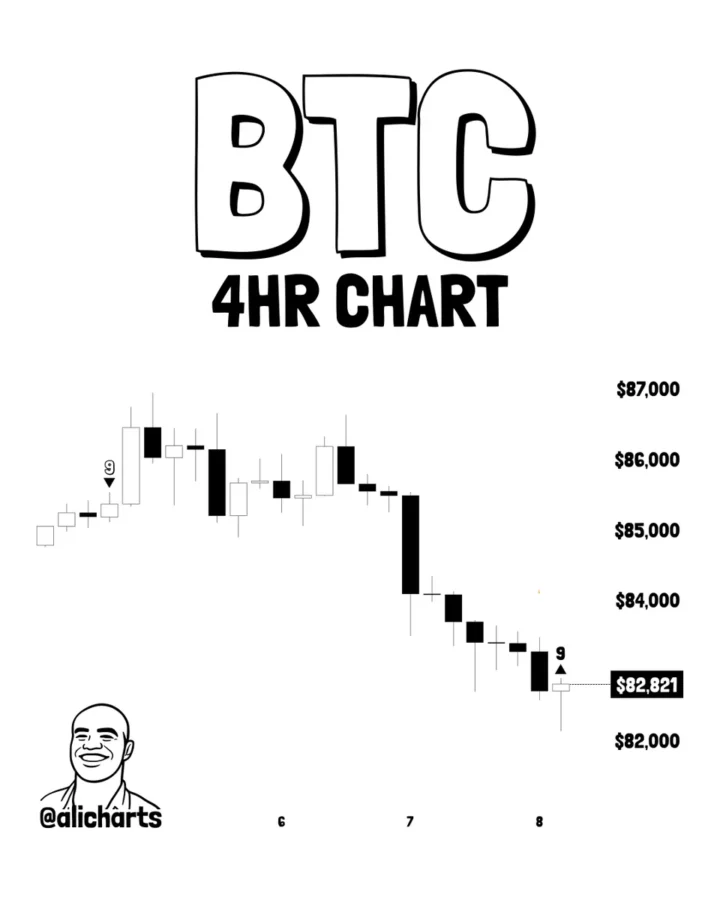
Nevertheless, the signal doesn’t assure that Bitcoin is bottomed out yet. BTC will have to prove its case by means of price action. A reversal above the nearest resistance level will increase the chance of the bullish scenario, while further break below the new low will reduce the importance of the signal.
At this point, the $82,000 area becomes one of the key levels to keep an eye on amid the potential rebound of Ali Charts.
What Does the Bitcoin Price Setup Show?
Immediate support for bitcoin lies between $81,800-$82,000, not far from the current day’s lowest level. Staying above this zone may allow the bulls to drive Bitcoin higher towards $83,000 again.
Breaking the resistance zone at $84,000-$84,600 will be seen as a more clear signal of bullish momentum. In such a scenario, Bitcoin is likely to test the $86,000-$87,000 zone.
However, a clear breakdown below $81,800 will diminish the effectiveness of the bounce setup and increase exposure to further selling pressure on Bitcoin.
At the moment, the presence of the TD Sequential buying trigger provided by Ali Charts represents a possible technical driver for the bulls, but the price of Bitcoin needs to prove it through further actions. The breakout of the $82,000 region will serve as confirmation.
Also Read: Can Bitcoin Price Reach $100K in October? ETF Flows and Spot Demand Hold the Key
This article contains market analysis and price predictions. These are not guarantees. Crypto markets are volatile. Always DYOR. Not financial advice.


Be the first to comment