


What to know:
- Bitcoin is consolidating in a tight range, caught between major liquidity zones that may dictate its next directional move.
- A large sell wall sits between $79,000–$81,000, while strong buy support is clustered around $73,000–$75,000.
- Technical indicators show mild bullish strength, with RSI at 61.46 and price holding above key short-term moving averages.

Bitcoin is expected to remain static until further indication from the market. The market is currently trading within a narrow range. High liquidity ranges above and below the current price action will influence the next price move. The primary concentration is on how the price will respond to these ranges.
At press time, Bitcoin is trading at $78,335, with a 24-hour trading volume of $51.84 billion and a total market capitalization of $1.57 trillion. The BTC has gained a modest 0.03% over the last 24 hours, reflecting a stable but active trading environment.
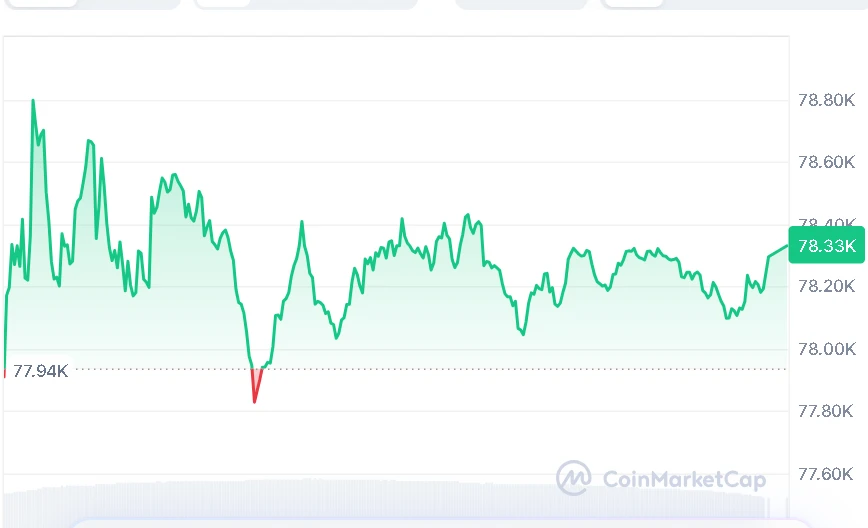

Source: CoinMarketCap

Also Read | Solana Moves Sideways as Support Holds, Eyes $88–$90 Resistance Target
Bitcoin Faces Liquidity Battle Zones
Crypto analyst Ted pointed out that Bitcoin is at the moment caught between two crucial liquidity clusters, which will help decide the direction of the next move for the crypto. According to Ted, there is a large cluster of sell orders from $79,000 to $81,000, amounting to more than $100 million.
Meanwhile, there is also a substantial concentration of buy orders in the $73,000 to $75,000 range, which has a liquidity level exceeding $65 million. This region can potentially act as a support level for the pair if selling momentum gains strength, because the buyers might enter the market actively. According to Ted, the price may move towards these regions of liquidity due to market makers’ tests.
Bitcoin Momentum Faces Resistance Pressure
The technicals of Bitcoin reflect a steady framework. The RSI is at 61.46, which is above 50, indicating positive strength without being overbought. It is trading above the 20-day SMA of $76,508 and the 50-day SMA of $72,506.
But the 200-day moving average at around $83,851 is still higher than the present value and serves as a major resistance point. Any breakout from the current levels would require a substantial amount of buying pressure and market validation.

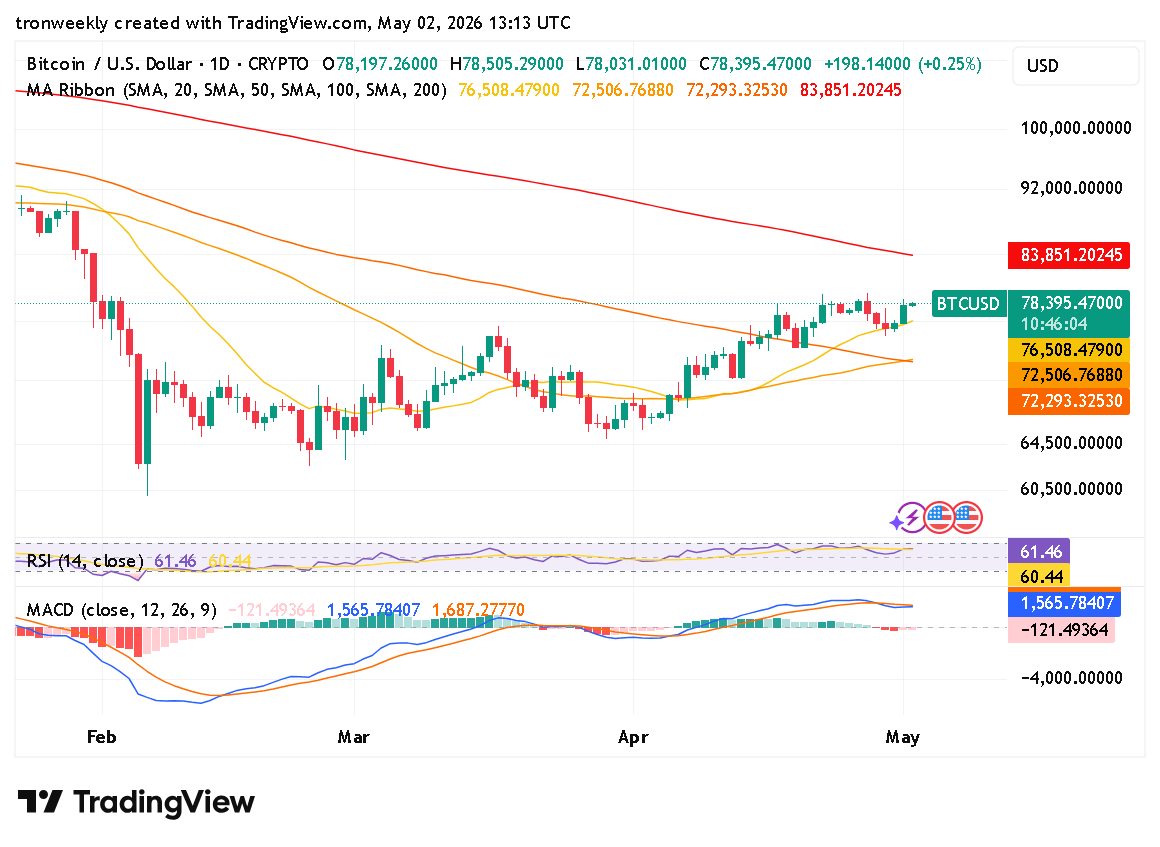
Source: TradingView
The MACD line remains above the signal line, indicating that buyers have some degree of dominance. But the histogram shows a reduction, suggesting the strength of buyers is waning, thus posing a risk of consolidation or correction.
Overall, Bitcoin is trading in a balanced manner with liquidity zones around the price helping keep the market alive as it seeks to find its next move.
This article contains market analysis and price predictions. These are not guarantees. Crypto markets are volatile. Always DYOR. Not financial advice.
Also Read | Hedera (HBAR) Falling Wedge Formation Hints at Possible Reversal Rally to $0.22

Be the first to comment