


What to know:
- Ethereum (ETH) Price remains under pressure after repeatedly failing to break the $2,400 resistance level.
- Market momentum indicators such as RSI and MACD suggest weakening bullish strength and a balanced-to-soft market structure.
- On-chain data shows Ethereum Realized Cap rising after weeks of stagnation, indicating a gradual return of fresh capital.

Ethereum price has been bearish after failing to breach critical resistance barriers at $2,400. At press time, ETH is trading at $2,300.40, which has seen 24-hour volume transactions of $22.90 billion, while the market capitalization stands at $276.90 billion. ETH Price has declined 2.02% over the last 24 hours.

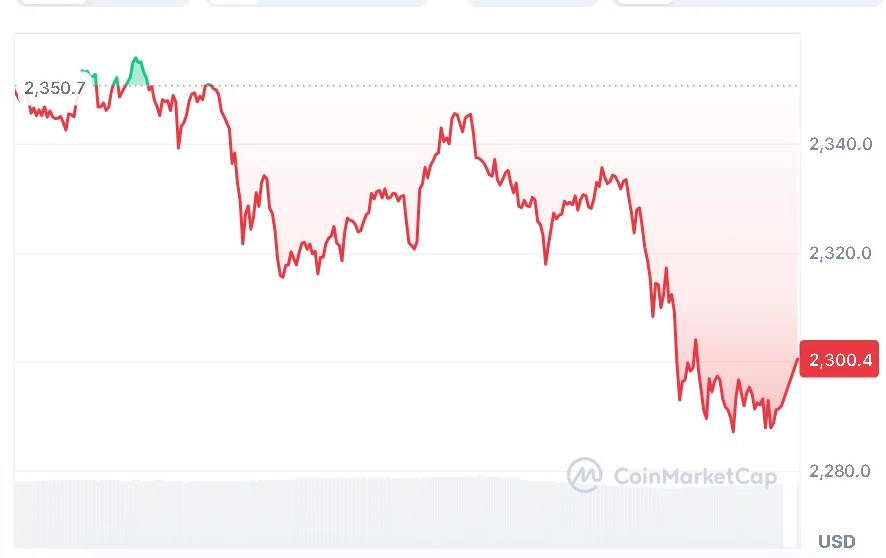
Source: CoinMarketCap
Also Read |South Korea Confirms Digital Asset Taxation From January 2027

Ethereum Realized Cap Shows Recovery
Crypto analytics firm, Alphractal, signaled that there were some early indications of change in on-chain dynamics. Alphractal noted that the ETH Realized Cap was increasing after eight weeks of stagnation. This development implies that fresh funds are gradually coming back into the blockchain despite the low ETH Price.

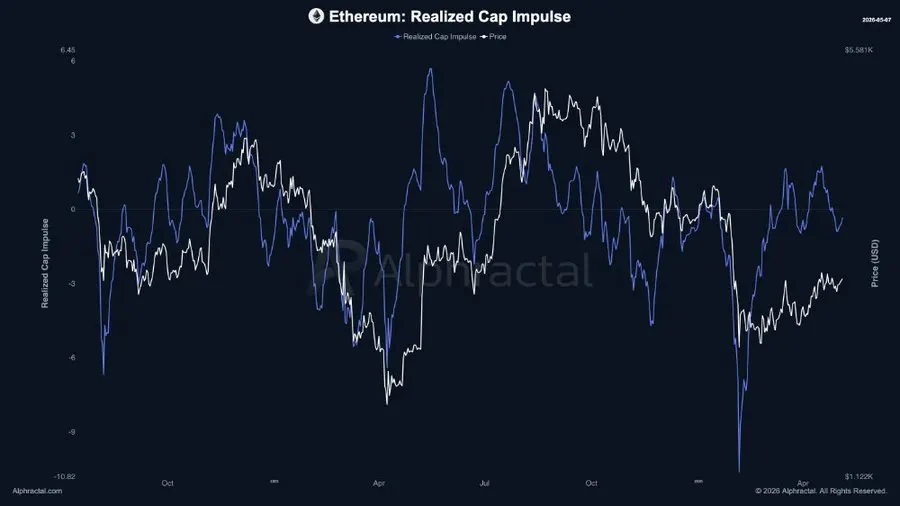
Source: Alphractal’s X Post
Ethereum Price Faces Strong Resistance
The ETH Price tried to reach levels of $2,374, yet fell back from there. A Crypto analyst, Ted, commented that despite several attempts to remain above $2,400, they were unsuccessful, with the reason being poor demand on the spot market. Until the situation changes for the better, the Ethereum Price will keep struggling with rises.
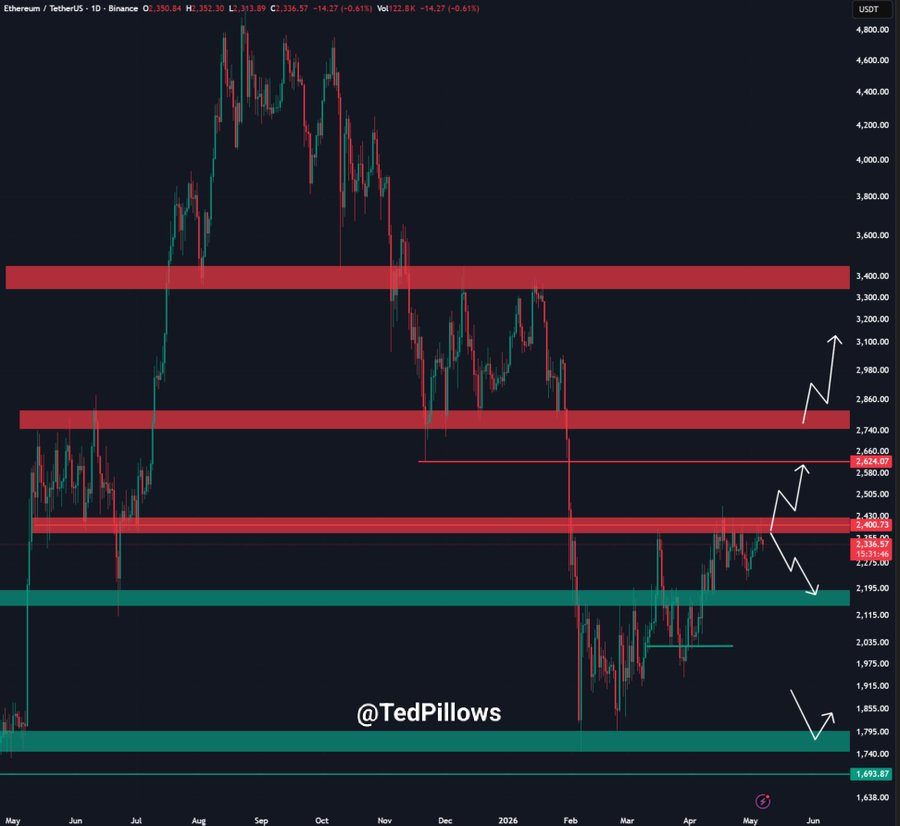
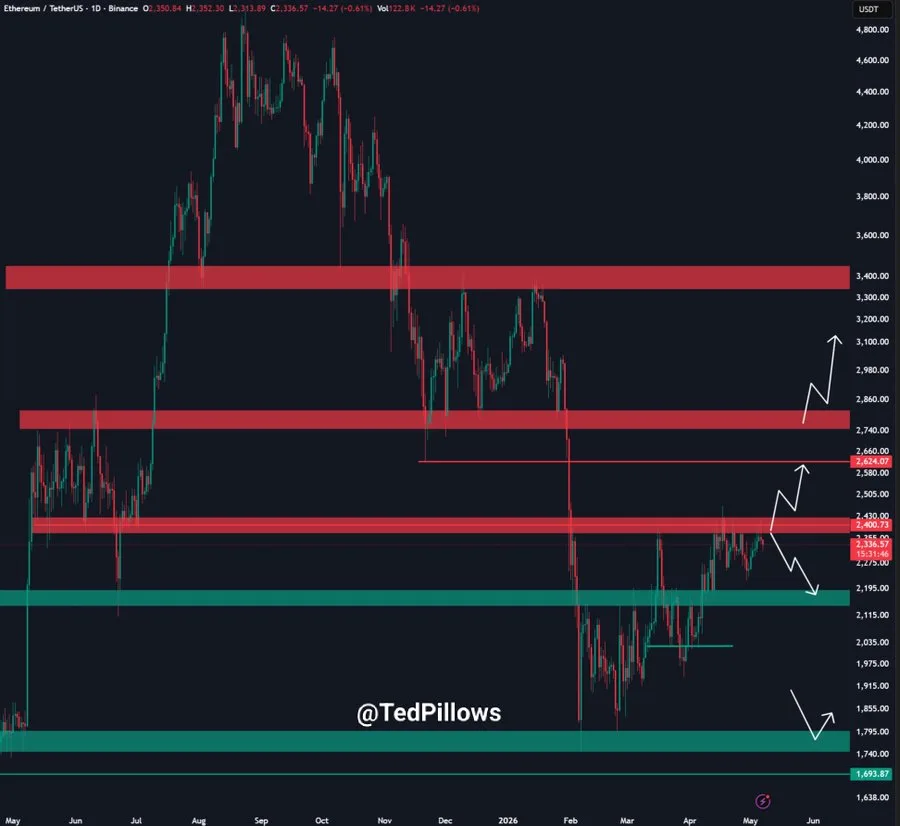
Source: Ted’s X Post
Ethereum Price Momentum Weakens Below Key Levels
The ETH price is currently trading around $2,300; however, technical indicators point to weakening momentum. The Relative Strength Index (RSI (14)) currently rests at 50.79, which is lower than its moving average at 53.66. This indicates that the ETH price is currently in a balanced market condition.
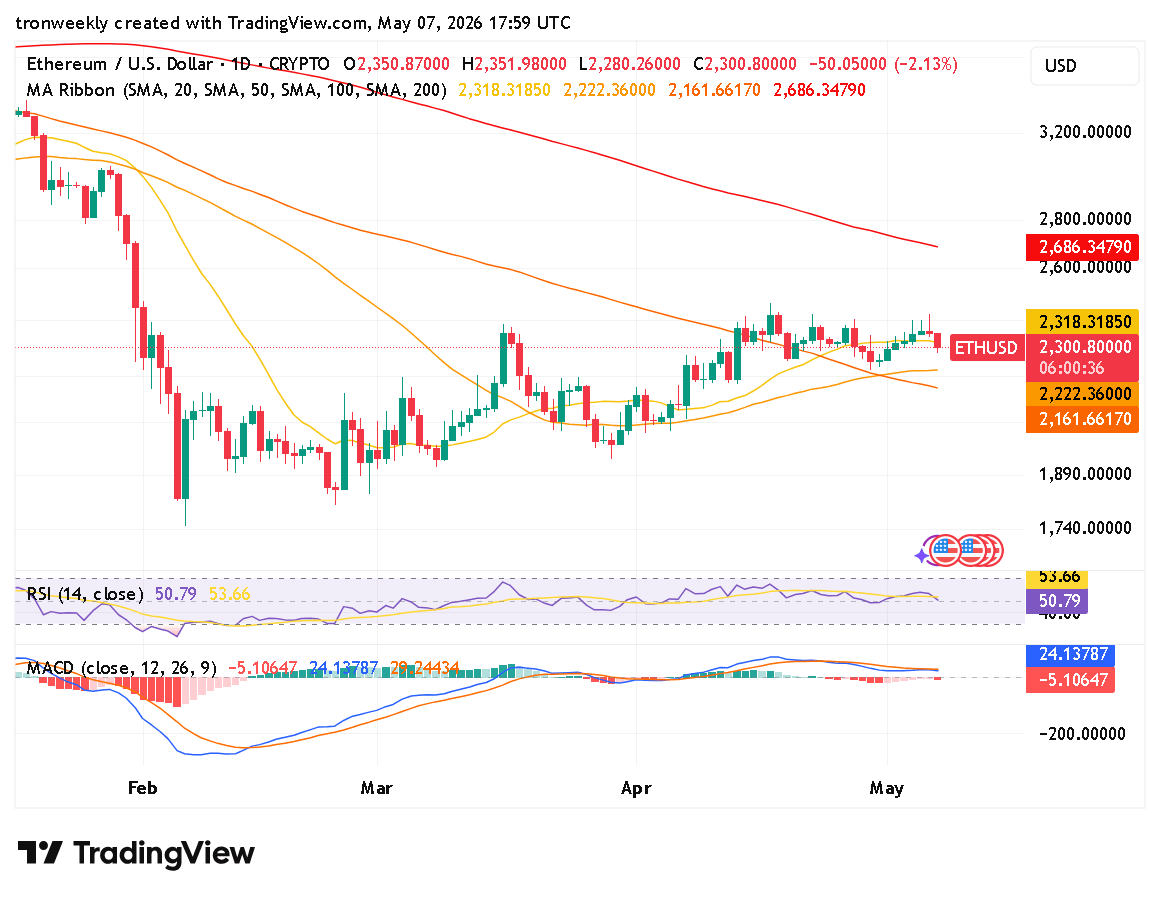

Source: TradingView
Furthermore, the MACD is another confirmation of weakening momentum. While the MACD line stands at 24.13, it remains below the signal line of 29.74. The histogram is now showing a negative value of -5.10. This suggests that the upward momentum on the ETH price is waning.
Despite the ETH price being above the 20-day SMA at around $2,318, there seems to be indecisiveness in the present setup. Without the return of increased buying interest, the Ethereum Price could remain range-bound or even drop further.
This article contains market analysis and price predictions. These are not guarantees. Crypto markets are volatile. Always DYOR. Not financial advice.
Also Read | Shiba Inu (SHIB) Price Analysis: Falling Wedge Pattern Signals Potential Breakout

Be the first to comment