



AAVE is showing signs of a potential bullish reversal as buyers attempt to stabilize after its recent rally. The developing chart structure points to renewed upside momentum if resistance is reclaimed. Meanwhile, derivative positioning and growing Aave v4 activity provide additional support for the token’s broader outlook.
AAVE Price Forms Bullish Reversal Pattern
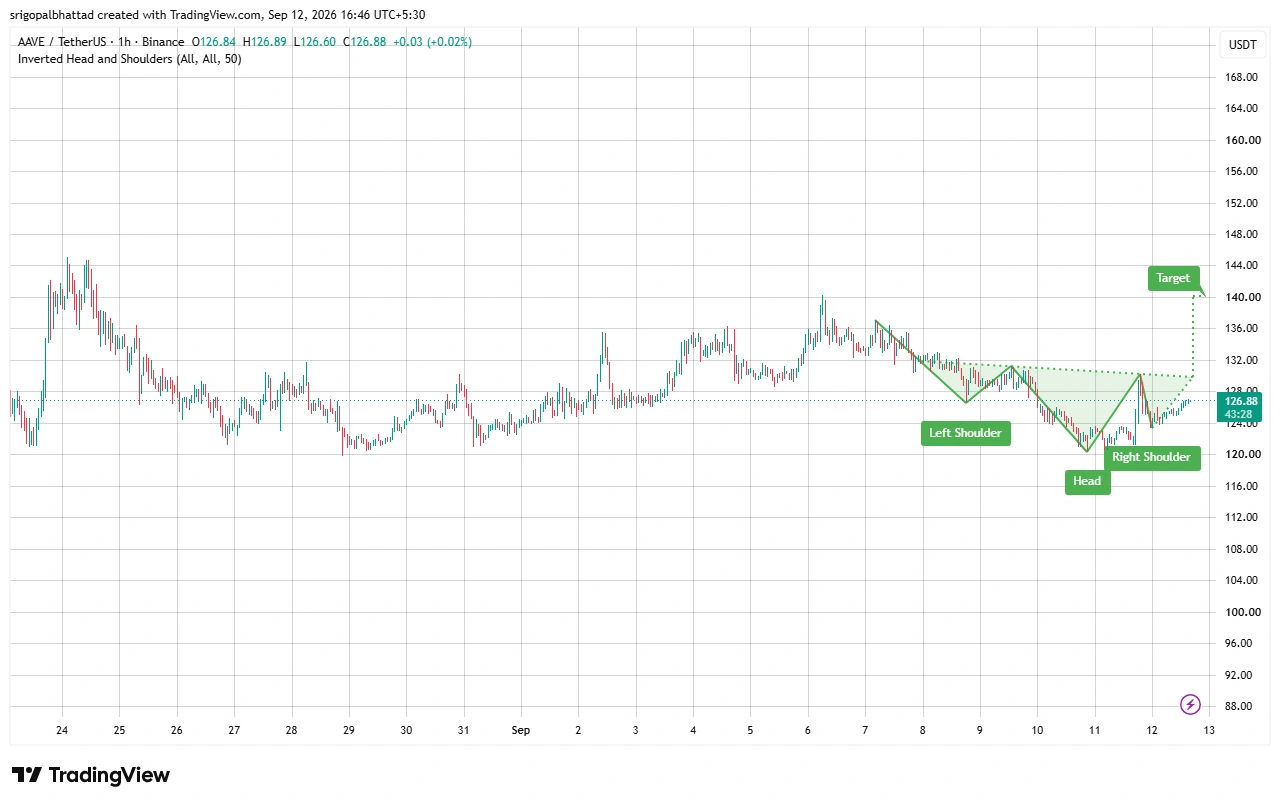
Aave (AAVE) is showing signs of a potential bullish reversal as traders watch an emerging inverted head-and-shoulders pattern on the 1-hour chart. Crypto analyst Crypto With Gopal highlighted the setup, identifying the $130–$132 region as the key neckline for confirmation.
AAVE was trading around $126.86 when the analysis was shared, while the broader chart structure showed the token attempting to stabilize after a strong rally. The analyst identified the $120–$124 area as important support and projected a potential move toward $140 if buyers successfully push the price above the neckline.
Source: Crypto With Gopal’s X Post

The pattern remains unconfirmed until AAVE decisively breaks and holds above the $130–$132 resistance zone. A rejection from that area could instead keep the token within its current consolidation range.
Also Read: AAVE Price Target $175 as Pennant Formation Signals Breakout Potential
AAVE Price Cools After Strong Summer Rally
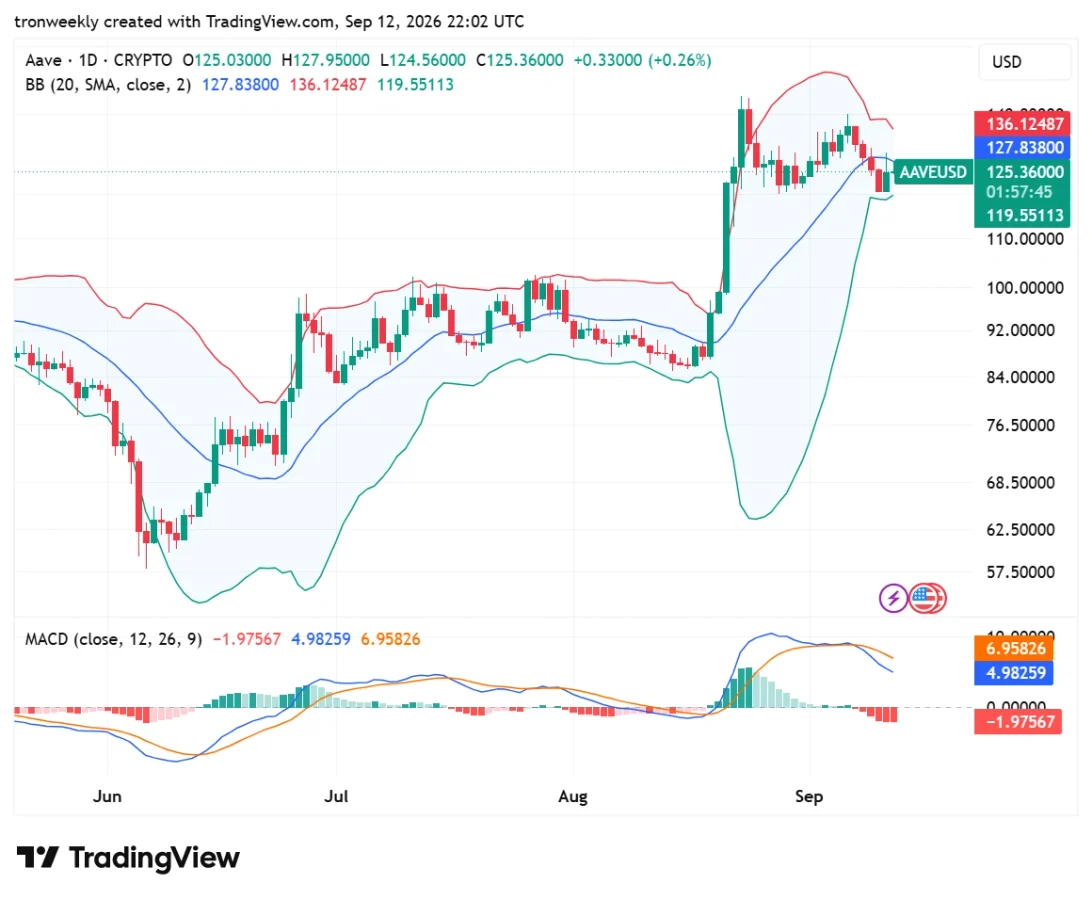
TradingView chart analysis shows that AAVE had managed to break away from a consolidation range that lasted for several months in the $84 to $100 region. This breakout brought about an impressive rise in price, which saw the coin go past the $140 mark.
The pullback has brought AAVE toward the $125 area, where buyers are attempting to establish a higher low. The price is also trading near the lower portion of its Bollinger Band structure. The lower Bollinger Band is around $119.55, while the 20-period moving average sits near $127.84.
Source: TradingView
This gives significance to the $120-$125 area for the short-term price movement of AAVE. Capturing the support level will help create a platform for testing of the neckline area between $130 and $132 once again.
MACD Signals Short-Term Selling Pressure
The momentum indicators indicate that the AAVE token is currently undergoing cooling down instead of having a total collapse in its overall system.
The MACD line currently stands at about $4.98, with the signal line at about $6.95. Both lines stay above the zero line, thus keeping the overall momentum formation bullish. Nevertheless, the bearish crossover and negative histogram, which stands at about -1.98, mean that the sellers now control the market.
The chart setup indicates that AAVE requires further buying activity for a change in the existing trend to take place. A breakout above the 20-period MA level will improve the case for bulls, whereas the breakdown of the $120-$124 support range will invalidate the emerging reversal setup.
Derivatives Market Shows Mixed Positioning
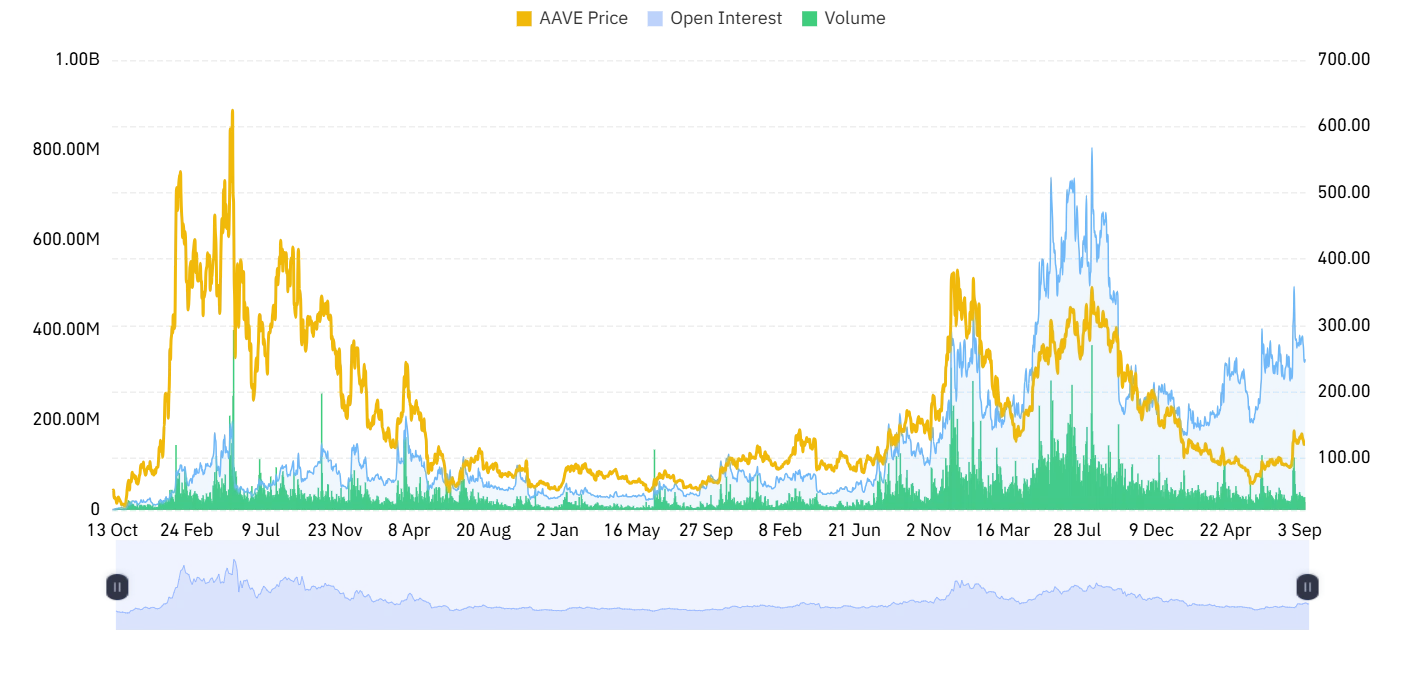
Data from AAVE’s derivatives also seems to reflect an ambiguous trend. According to Coinglass data, there has been a 37.58% decline in 24-hour derivatives trading volume.
Source: Coinglass
On the other hand, open interest rose by 1.71% to about $333.61 million. There seems to be a disparity between falling volume and increasing open interest, meaning that the trading public is still holding onto leveraged positions despite lower volumes.
Such positioning may make the next big move from AAVE more significant. A breakout with higher volume will bring more validation to the bull case, whereas a violent rejection can cause high volatility as traders adjust their leverage levels.
Aave v4 Deposits Surpass $900 Million
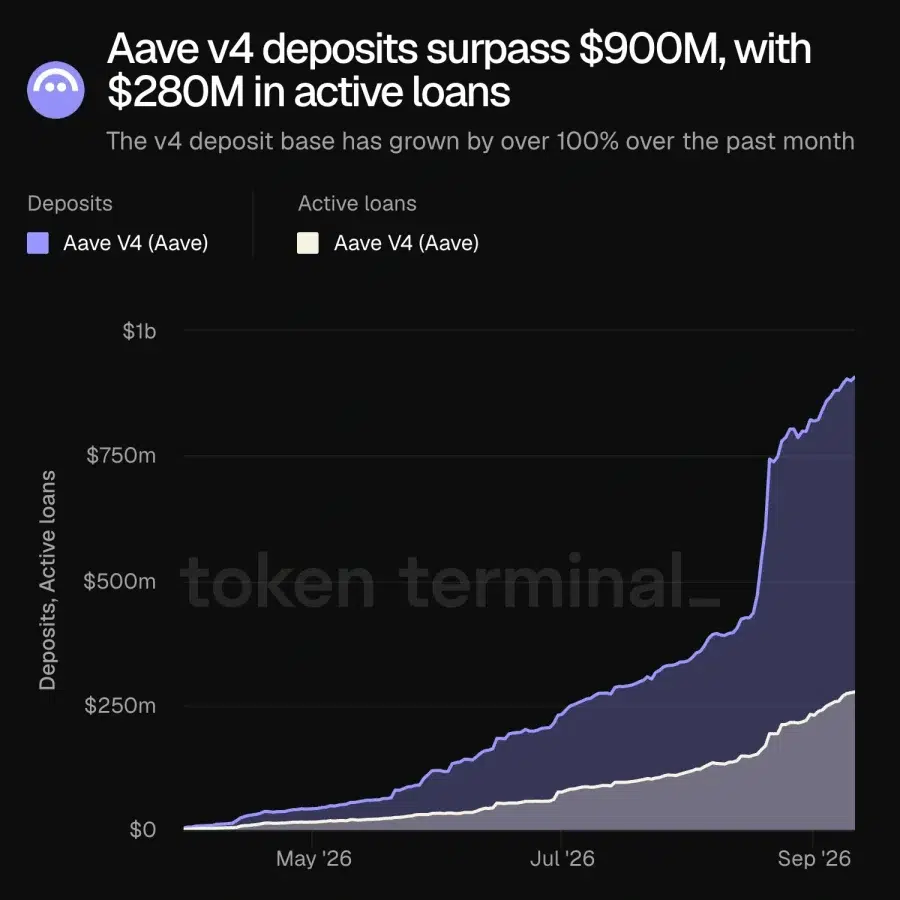
The basic activities in the Aave environment make up another aspect of consideration for traders tracking AAVE. According to Token Terminal, deposits on Aave v4 have exceeded $900 million, whereas active loans total about $280 million.
Source: Token Terminal’s X Post
The number of v4 depositors has also increased by more than 100% within the last month, reflecting a marked rise in the flow of capital to the upgraded lending platform.
This development forms an essential background for the technical configuration. Should the ecosystem’s activities continue growing as long as the AAVE coin trades within the support area of $120-$125, traders would shift attention to whether the coin can bounce back to the $130-$132 neckline.
For now, the $120-$124 support level and the $130-$132 neckline still hold as the major price levels to keep an eye on. An established breakout past the neckline level would bolster expectations for a push to $140, while falling short would continue AAVE’s consolidation.
Also Read: Aave ARC Powers Bullish Credit on L1 Network Now
This article contains market analysis and price predictions. These are not guarantees. Crypto markets are volatile. Always DYOR. Not financial advice.



Be the first to comment