



There is a fierce battle being waged between Bitcoin [BTC] bulls and bears as the price climbs back above $65K once more. The on-chain metrics covered in recent days showed that strong, sustained demand is not yet present to support a bullish trend reversal.
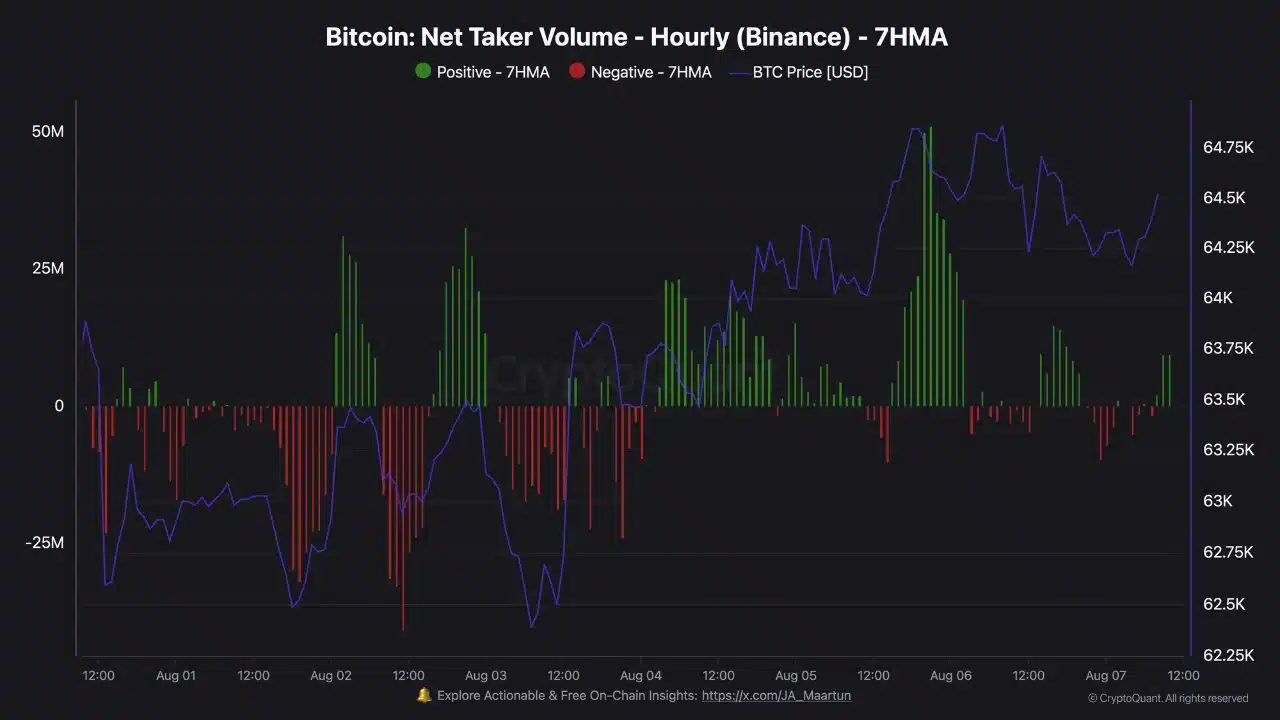
On 5th August, as Bitcoin approached $65K, the centralized exchange Binance saw a spike in taker buyer volume. This buying spree was not large enough to overcome the limit sell orders sitting overhead.
After absorbing the influx of demand, buyer exhaustion saw short-term price dips towards $64K in the last 48 hours.
The $65K-$67K zone will be key to determining the next impulse move.

What needs to happen to give Bitcoin’s price a bullish color?
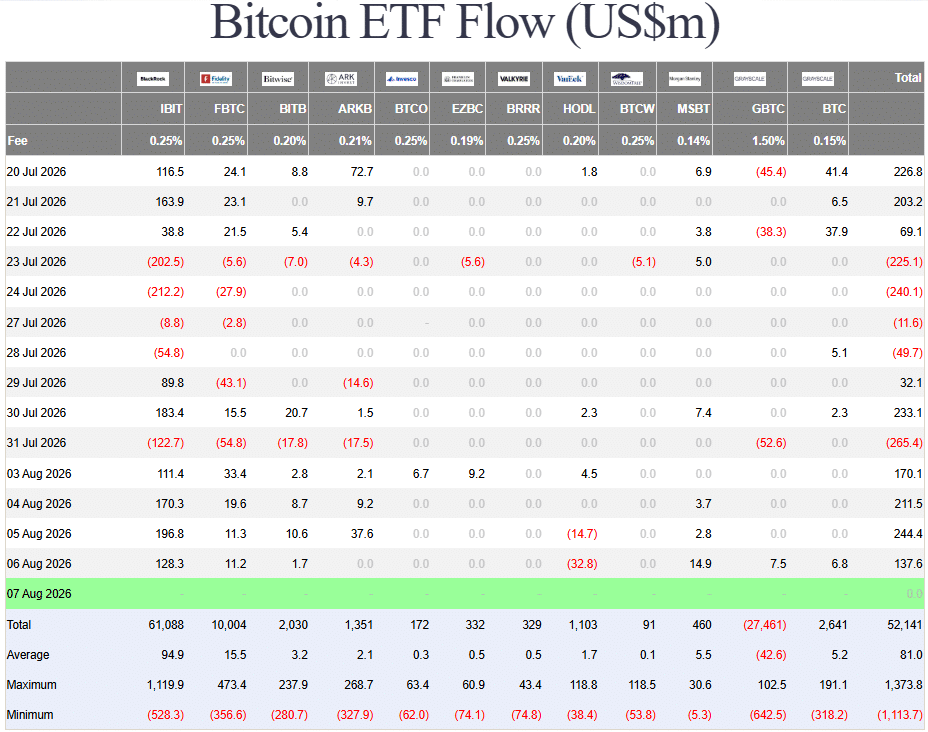
The Spot ETF flows were positive for the past four trading days. Since 3rd August, ETF flows measured a cumulative $763.6 million in inflows. This seemed to be an encouraging sight for the bulls gunning for a move beyond the $65K supply zone.
AMBCrypto had previously reported that HODLer accumulation was underway, but fresh capital inflows may be needed to catalyse a BTC move higher. At the same time, there could also be room for the ongoing bear cycle to take one step lower.
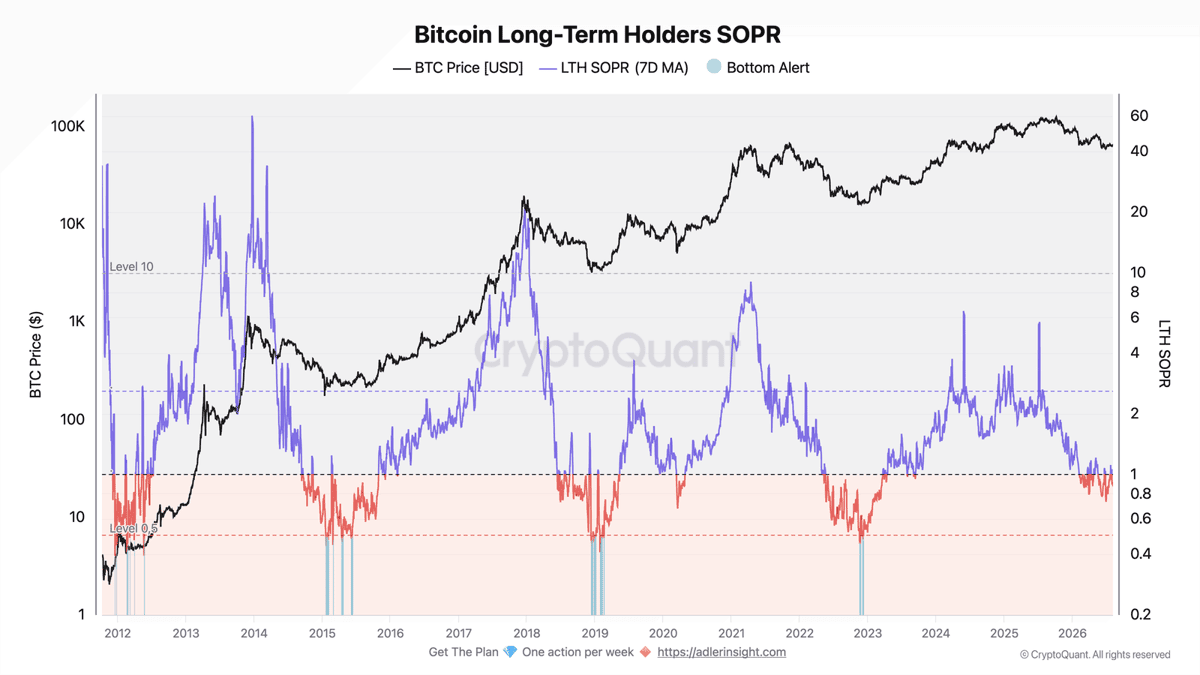
The LTH SOPR measures if the long-term holder coins are moving at a profit or not. Its 7-day moving average of 0.92 meant, on average, these coins were moving at a loss.
A drop towards 0.7 or lower would signal intense selling pressure from LTHs.
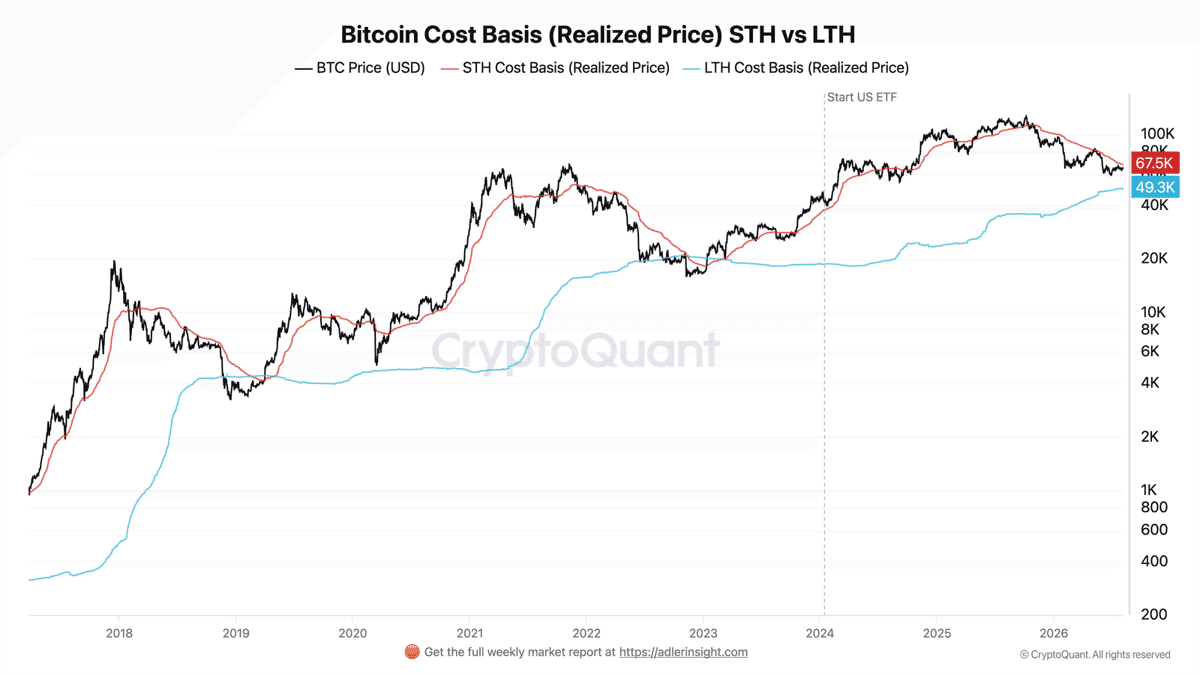
At the time of writing, Bitcoin’s price was 30% above the long-term holder cost basis at $49.3K, but still 5% below the short-term holder cost basis at $67.5K. Once again, the $65K-$67K area can be highlighted as an immensely important supply zone for bulls to conquer.
A price move past $67.5K and the LTH SOPR above 1 would signal a potential trend shift.
Are the current trends still firmly bearish?
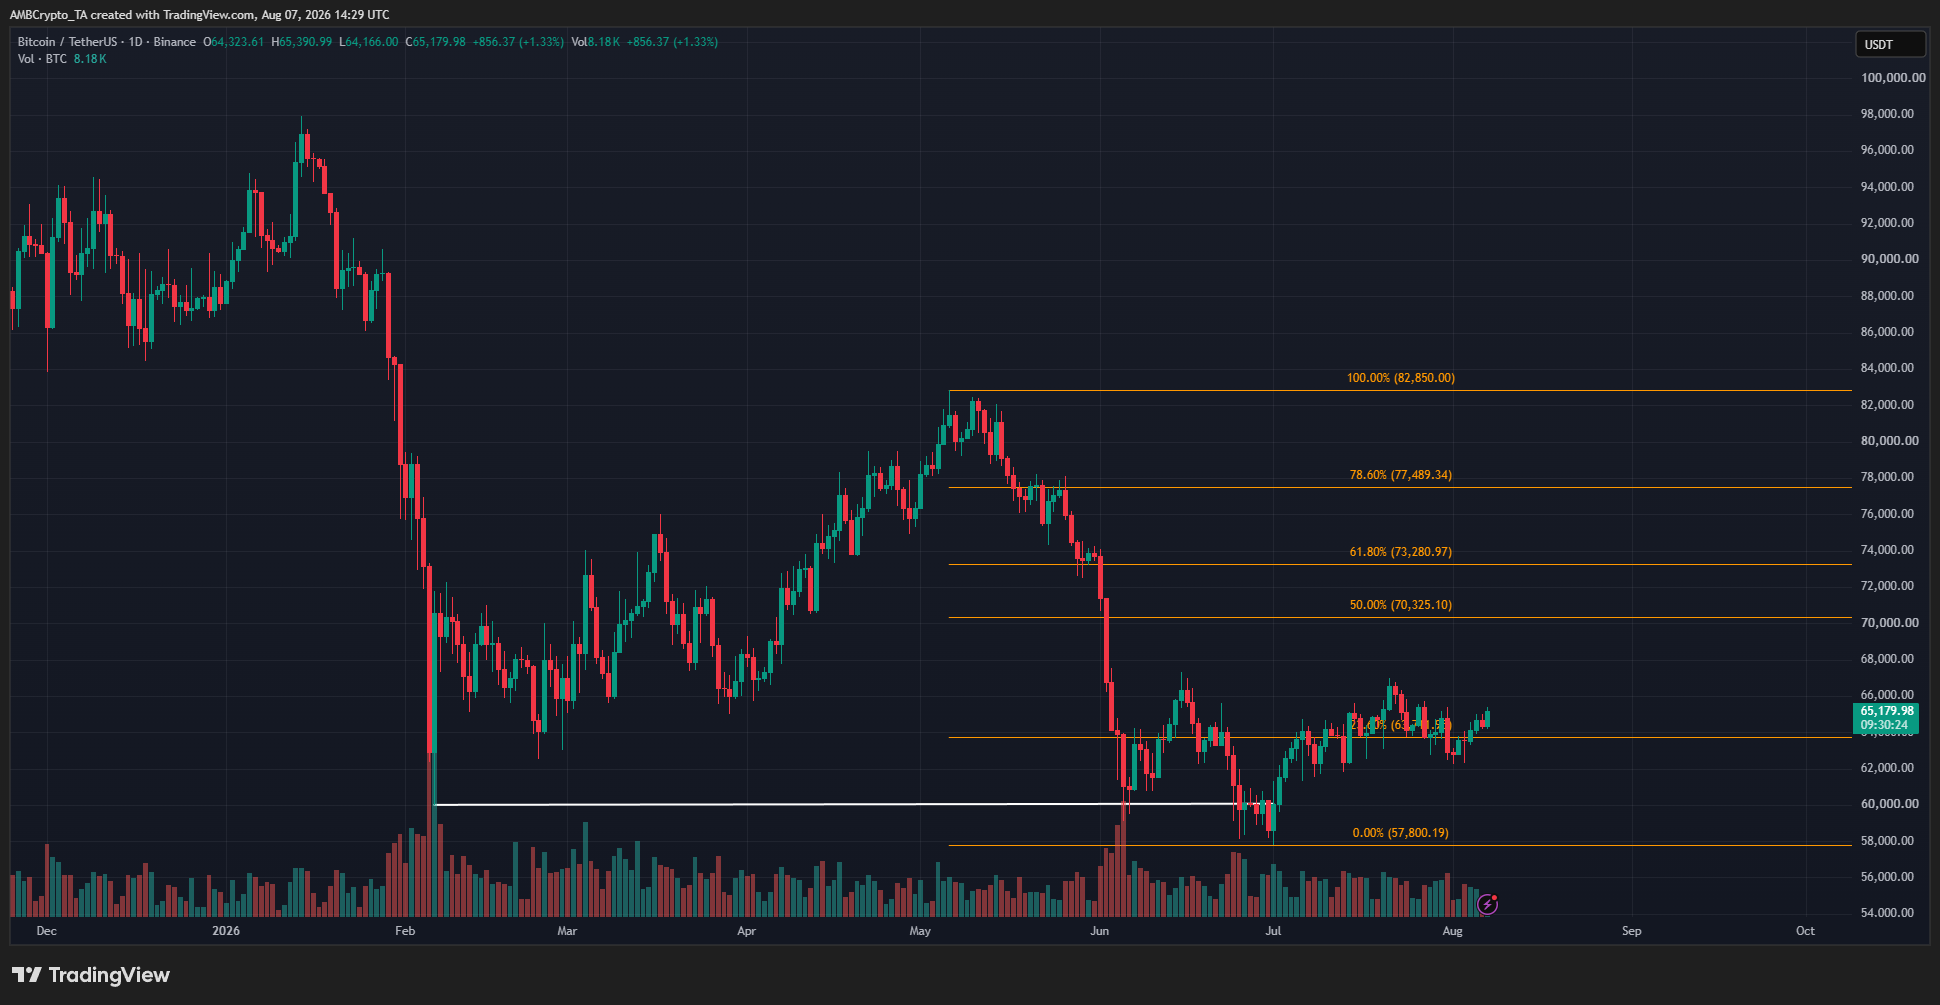
At press time, BTC’s swing structure on the 1-day chart was bearish. The current bounce had not even reached the 50% level at $70.3K. A bounce could go as high as $77.5K-$82.8K and still maintain a bearish swing structure.
Investors could choose to wait for the $82.8K-level to be breached, along with recovery in capital flows and on-chain signals. This, before turning their long-term bias bullishly.
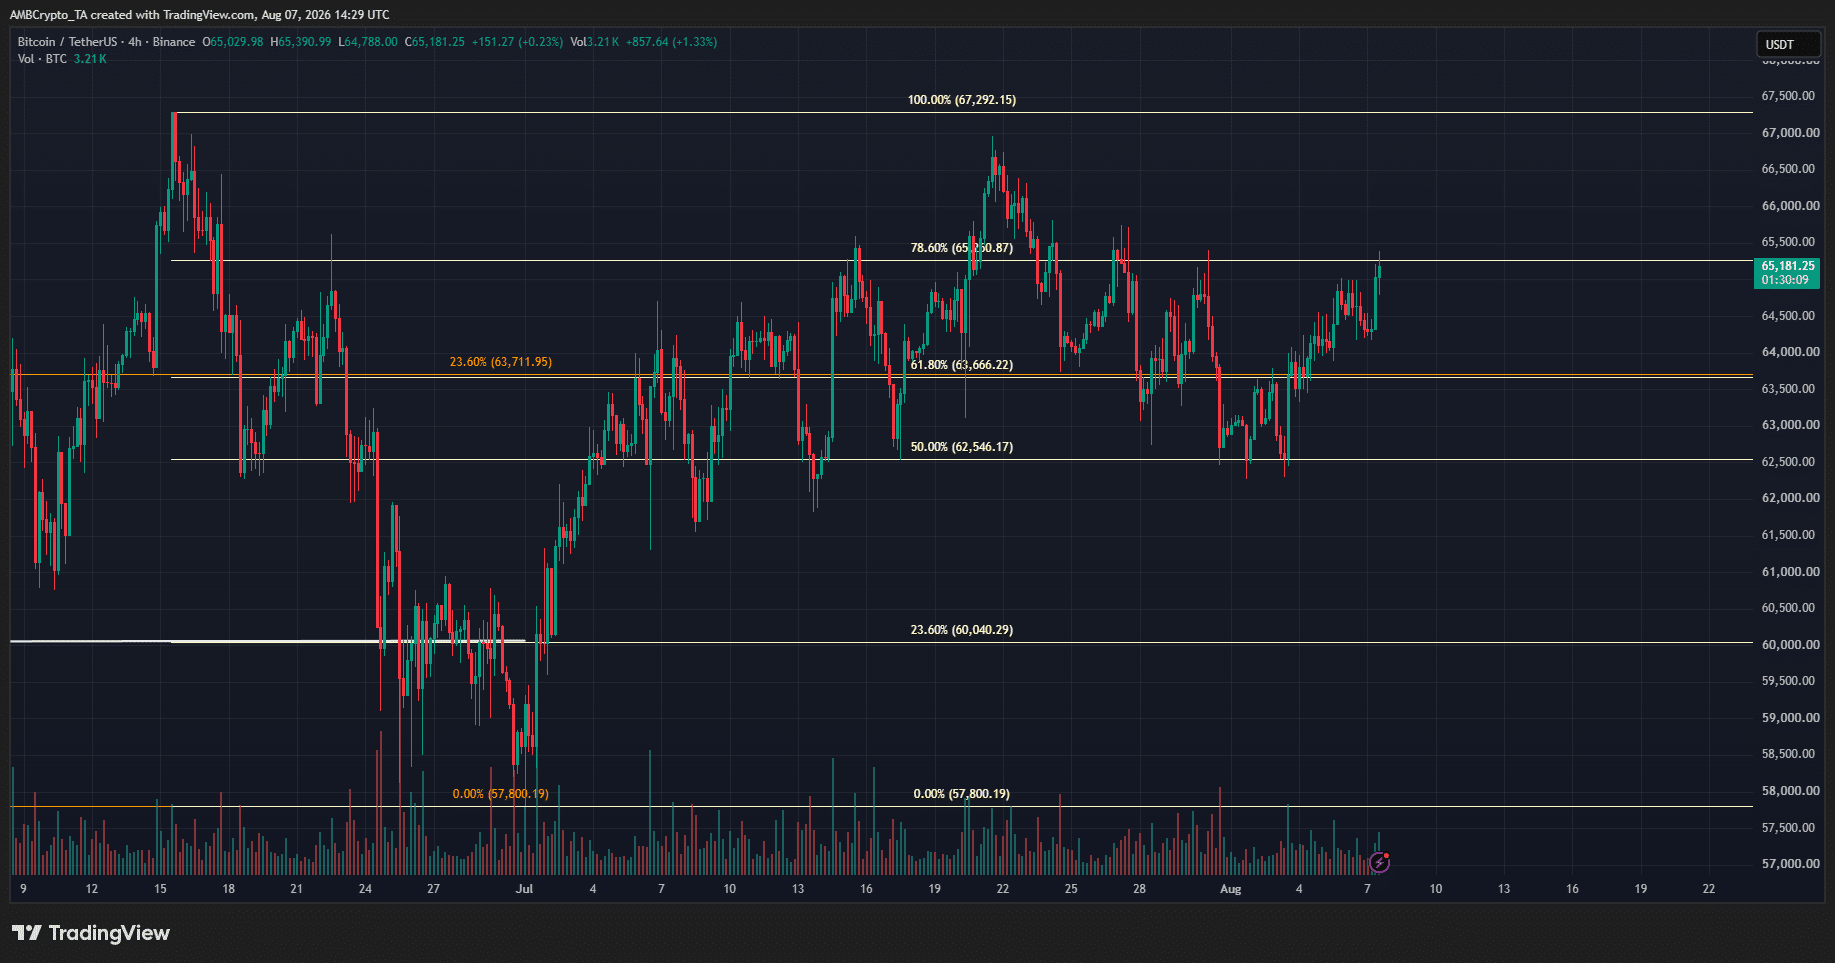
In the short-term too, Bitcoin’s price seemed to maintain a bearish bias. The $67.3K swing high from mid-June needs to be breached to give swing traders a reason to target long trades.
The sideways movement between $60K-$66.5K in July only signaled the continuation of the previous bearish trend. The $67K-bottleneck must be defeated to shift this narrative.
Final Summary
- Swing levels at $67.3K and $82.8K will be key to determining Bitcoin’s price direction in the coming weeks.
- Its price is still 30% above the long-term holder cost basis, with the current market stress only affecting the higher cost portion of LTH BTC holders.




Be the first to comment