


What to know:
- Bitcoin’s current structure still aligns with a bear flag nearing a critical decision point.
- Price is holding above key short-term support but faces strong resistance near $80K–$82K.
- Market momentum is improving, yet signals show hesitation rather than a clear breakout.

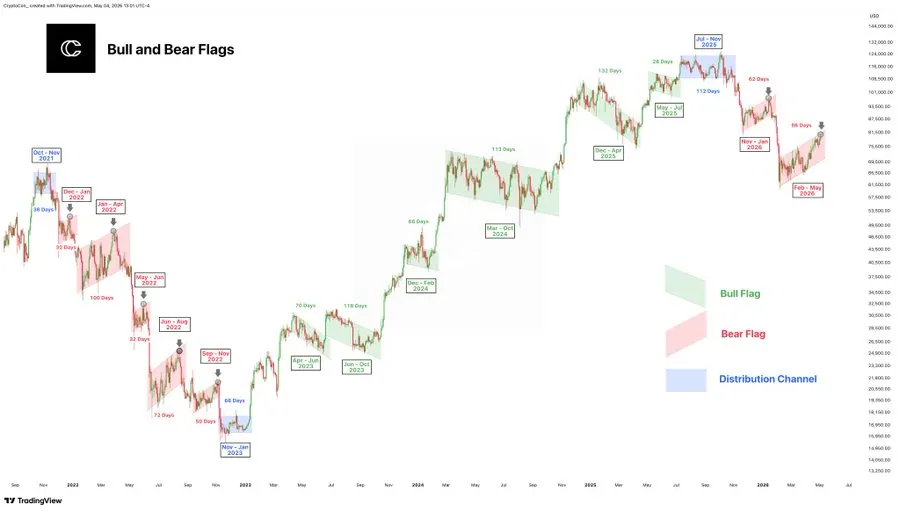
Bitcoin is once again at a critical technical stage, as market watcher CryptoCon pointed to a continuing bear flag pattern forming on the higher timeframe.
Data shared on May 4 shows the current structure has already stretched to 86 days, approaching the longest duration of 100 days recorded since November 2021.
The problem is where prices are going. Prices have retraced to the upper end of the channel range, an area that typically causes hesitation as far as the trend is concerned.

Previous price behavior suggests that after the second attempt to challenge this resistance area, prices often begin falling. The second attempt at this resistance area is occurring right now, putting us in a delicate situation.
When we zoom out on the big picture chart, the price action shows that Bitcoin has consistently risen throughout 2023 to 2025, thanks to several bull flags.
This is because the bull flags had short durations and were followed by significant breakouts. On the other hand, the current bear flags have longer durations and involve more intricate patterns.

Source: X
Also Read: Bitcoin Miner Hut 8 Secures $200M Credit Facility From FalconX
Bitcoin Multi-Year Market Structure and Distribution Phases
There is clearly an extended period of shifting from rising prices to a stage of sell-offs and falling prices. Zones where there were sell-offs ahead of massive declines mean that large speculators took profits gradually before the tops of the cycle.
Following these zone breaks, long-term bear markets started and remained in consolidation for an extended period. Now, what can be observed is that the recovery is relatively slow compared to the previous ones.
In the previous cases, there was a sudden and fast increase, while in the present case, there is a more careful and conservative one.
This is also reinforced by timing models. In a bull trend, the flag breaks out rapidly, whereas bearish formations can take more time to develop. The present formation has been building for 86 days, which is consistent with this model.
Indicators Show Strength, but Resistance Holds Firm
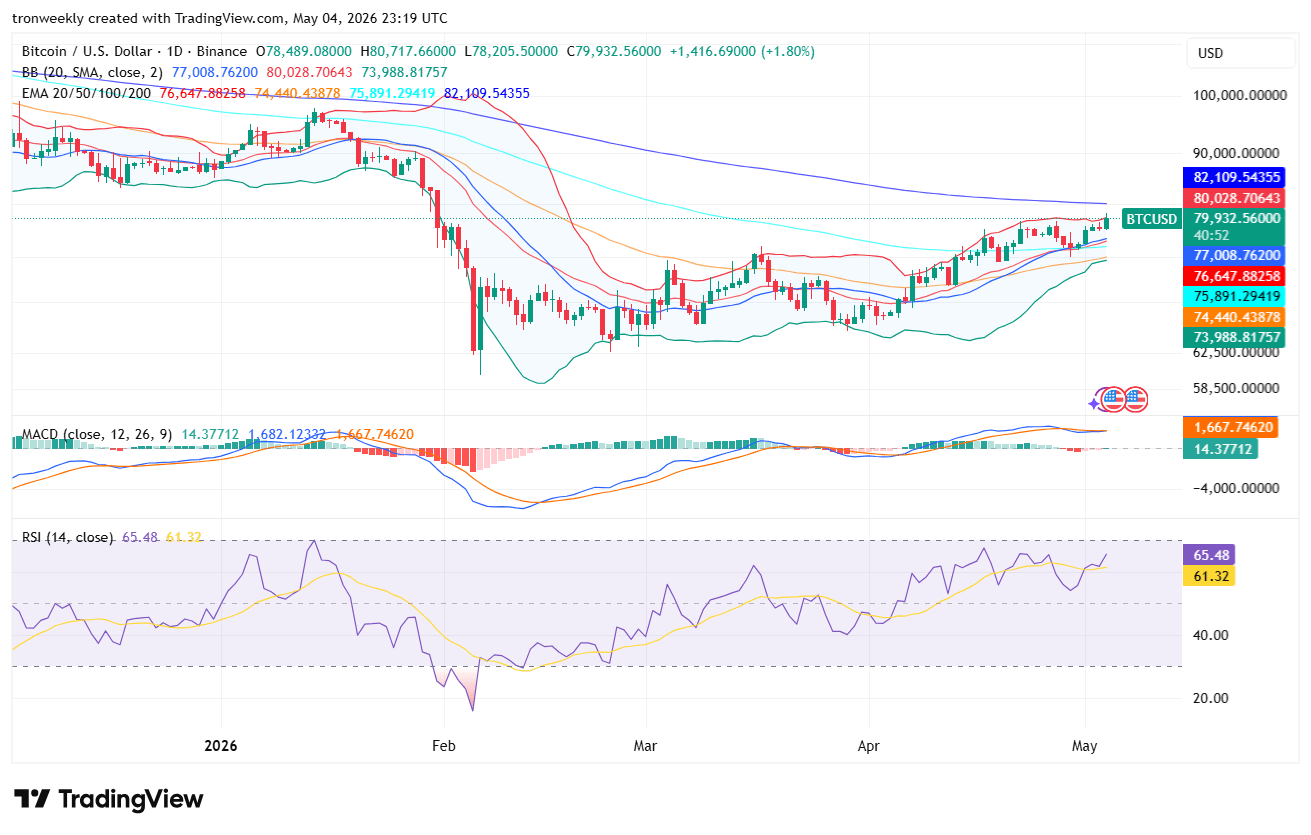
Bitcoin trades in a range between $79,000 to $80,000, after recovering from its previous decline, as per analysis from TradingView. Bitcoin continues to trade above its mid-Bollinger Band level of $77,000.
However, repeated touches of its top Bollinger Band level at $80,000 point to increasing buy-side pressure, but there has been no confirmation of a breakout move yet.
While the short-term moving averages, such as the 20 EMA and the 50 EMA, are bullish, the long-term moving average at $82,100 is holding its ground as an important resistance level.

Source: TradingView
As long as this level remains intact, the trend will be considered neutral. The momentum oscillators provide conflicting signals. On one hand, the MACD is positive, suggesting that purchases continue to occur.
However, the histogram is leveling off, meaning that the momentum is not increasing. On the other hand, the RSI value at 65 suggests that Bitcoin is in a good position without being overbought.
This article contains market analysis and price predictions. These are not guarantees. Crypto markets are volatile. Always DYOR. Not financial advice.
Also Read: Bitcoin (BTC) Rising Open Interest Hints at Imminent Price Explosion to $85,000

Be the first to comment