



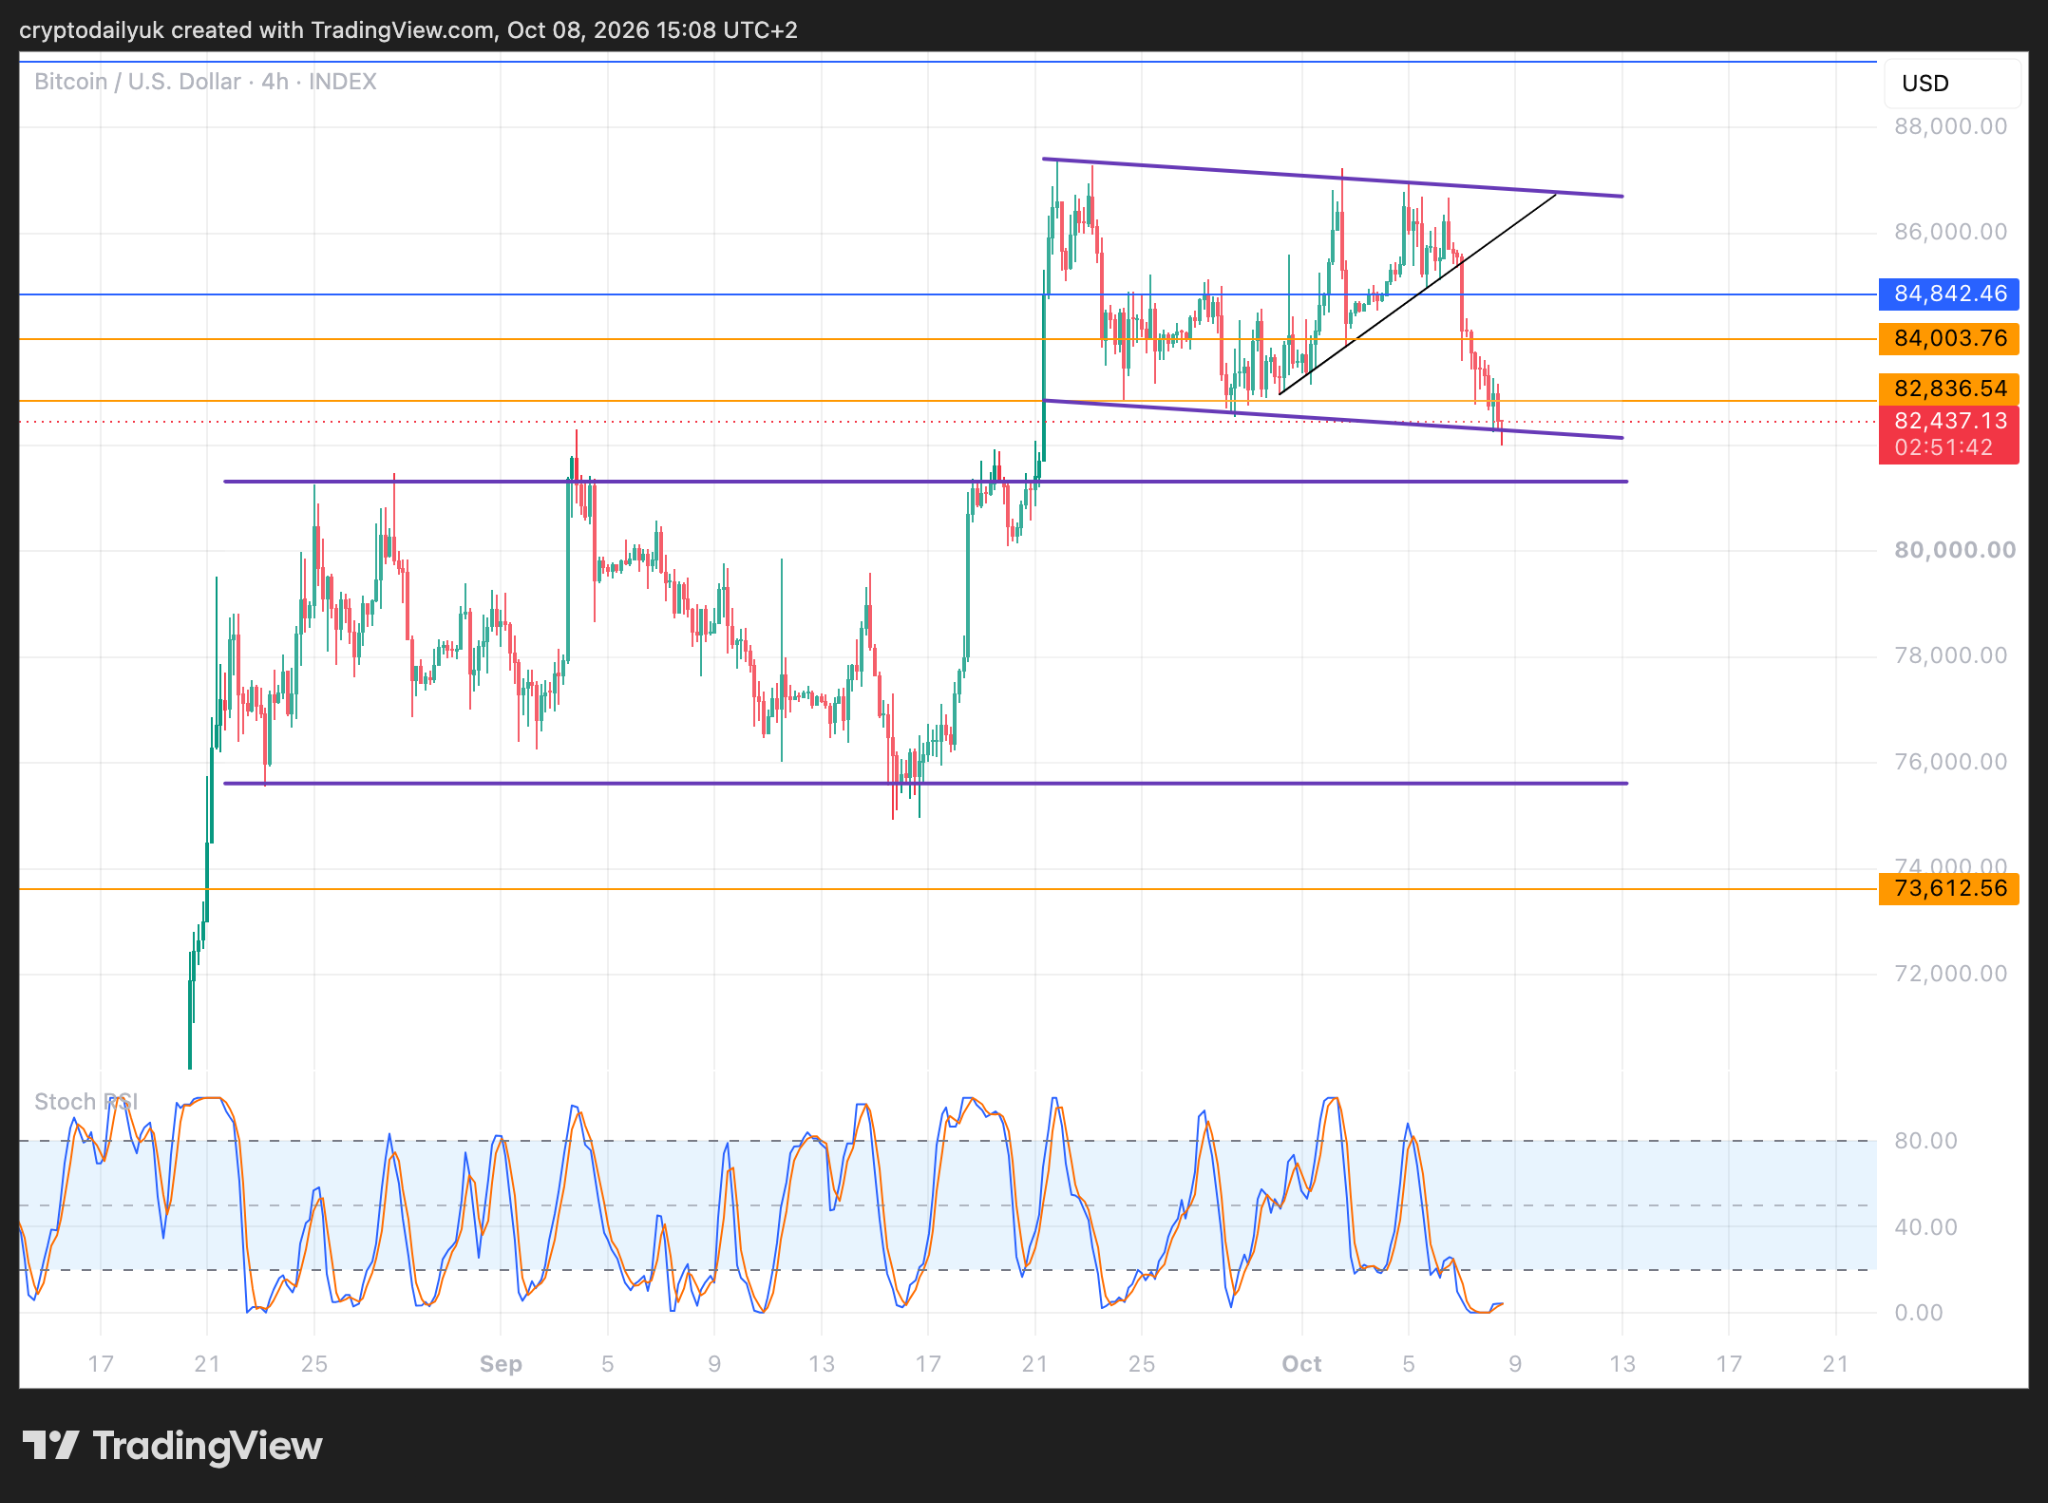
In terms of a parallel channel it looks as though the Bitcoin price is breaking down, with $81K at least in its sights. However, if a tilt is put onto the channel, the price action fits better inside, and this gives the $BTC price a bit more leeway to the downside. Could it be that a bounce might be coming instead?
Adjust the channel and get a bounce
Source: TradingView

It’s amazing what a little tilt can do to what was a horizontal channel. A series of lower highs along the top of the channel, and now the third lower low for the bottom of the channel, all point to a bull flag that now has a bit of an angle on it – much more like a classic bull flag.
If this is how the flag is going to look, perhaps the more likely move now is a bounce back to the upside. Of course, even though the flag looks more like a proper bull flag, there’s nothing to say it still won’t break down. This remains to be seen. That said, there are now the minimum three touches along the bottom of the flag to make it valid. Therefore this last touch could see the bounce that takes the $BTC price back to the top of the flag and a breakout – global bond yields allowing.
50-day SMA could play a role in supporting the $BTC price
Source: TradingView
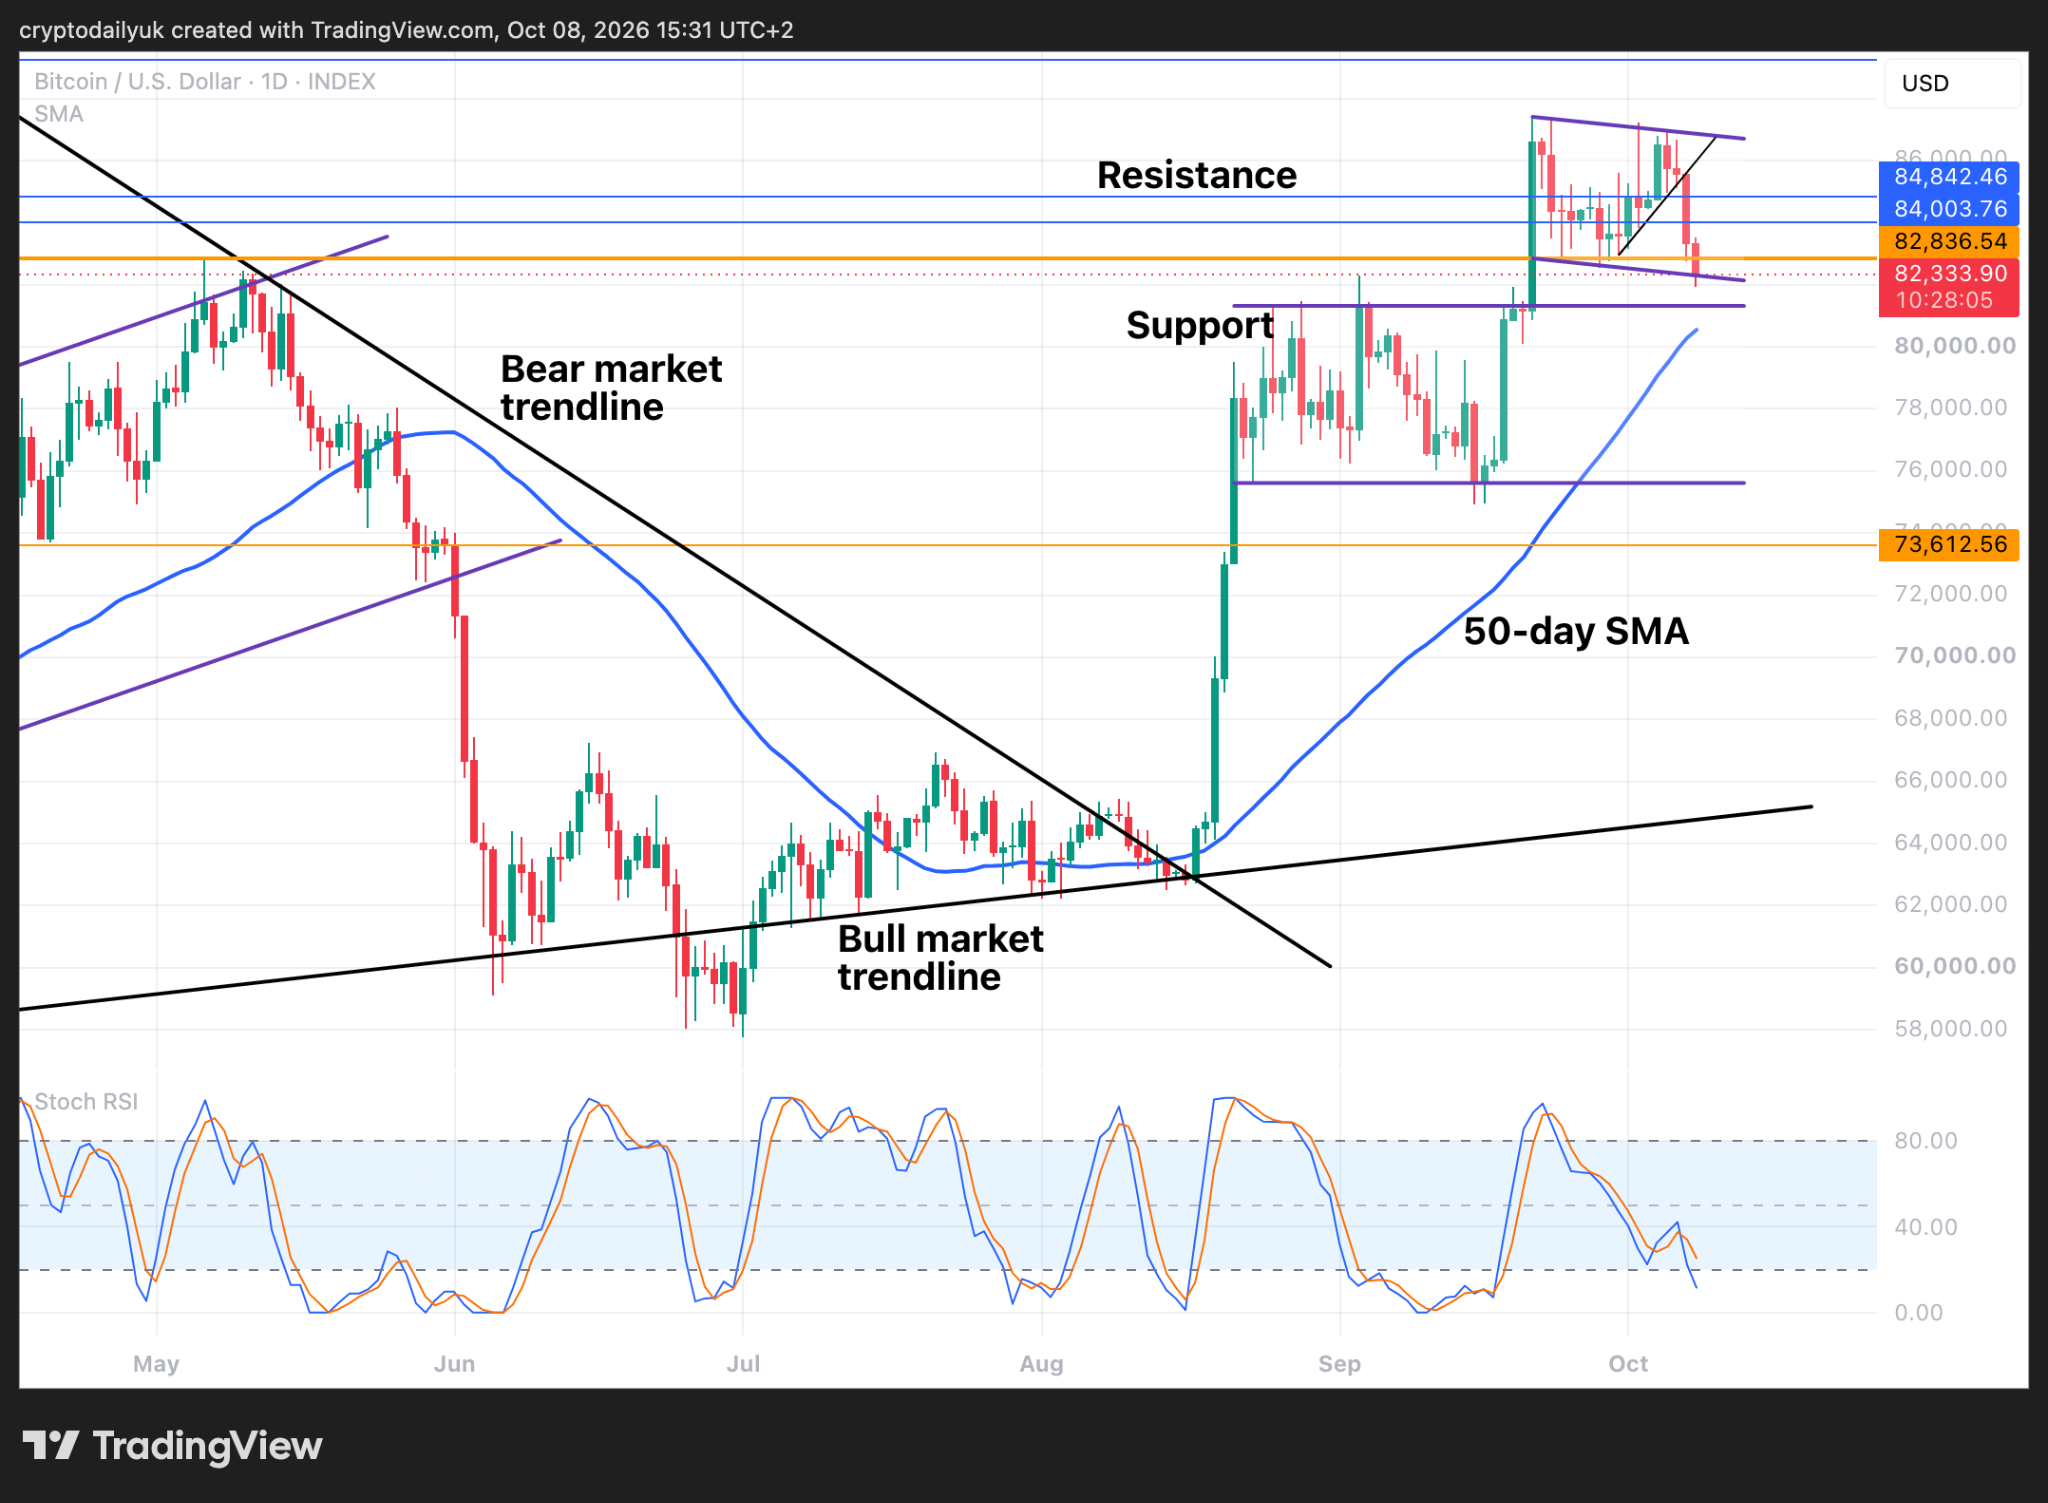
Out into the daily timeframe the thicker orange horizontal line denotes critical support, which the $BTC price is currently underneath. This marks the top of the last big bear flag in the bear market, and is a very important step in breaking the bear trend. The bulls will be fervently hoping that this touch of the bottom of the channel is a solid one, and that a resulting bounce can take the price back above the horizontal support by the end of the day.
If the $BTC price does break down, the 50-day SMA may play a role in making sure that the breakdown only gets as far as the top of the previous channel. This moving average is not far away from being able to lend its weight to the support of the channel top.
Bulls need the $BTC price to survive the day
Source: TradingView
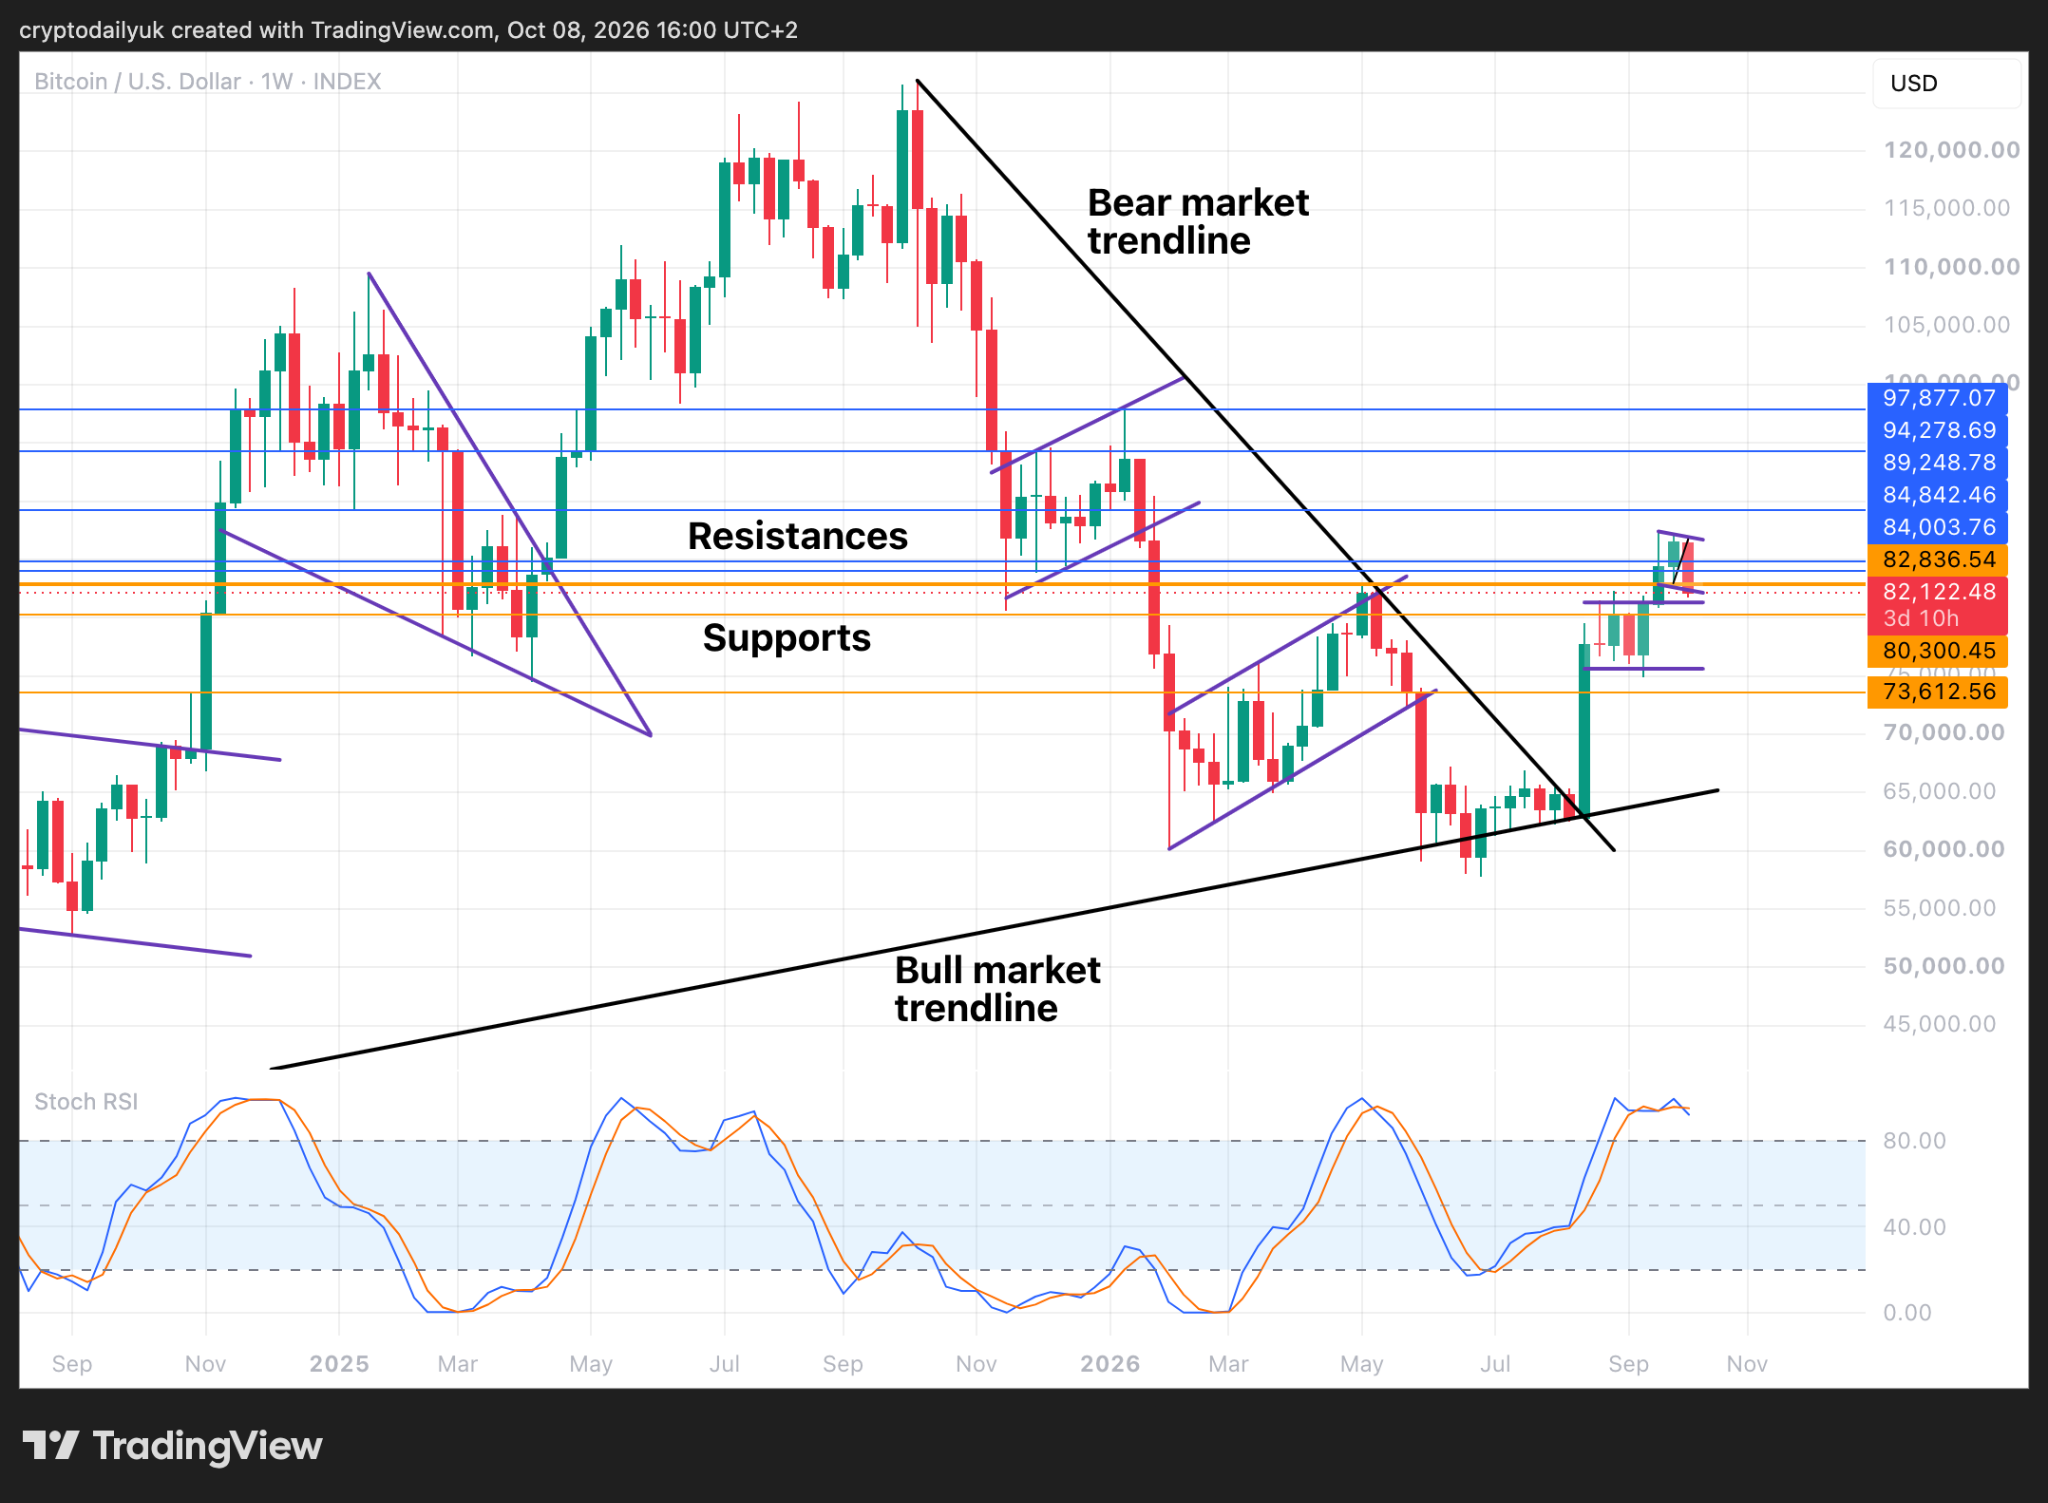
If the current rally structure were a simple pile of planks stacked up on top of each other, it might be starting to wobble at this point. The higher the structure reaches, the more unstable it becomes, unless of course that structure is protected by continuation patterns like bull flags – which it is.
The bulls just need the $BTC price to survive the day, and that means the price staying within the upper bull flag. This is the fourth day of red candles, and so a green candle or two may be on the way. For Bitcoin to continue its rally this current bull flag structure needs to hold.
Disclaimer: This article is provided for informational purposes only. It is not offered or intended to be used as legal, tax, investment, financial, or other advice.





Be the first to comment