



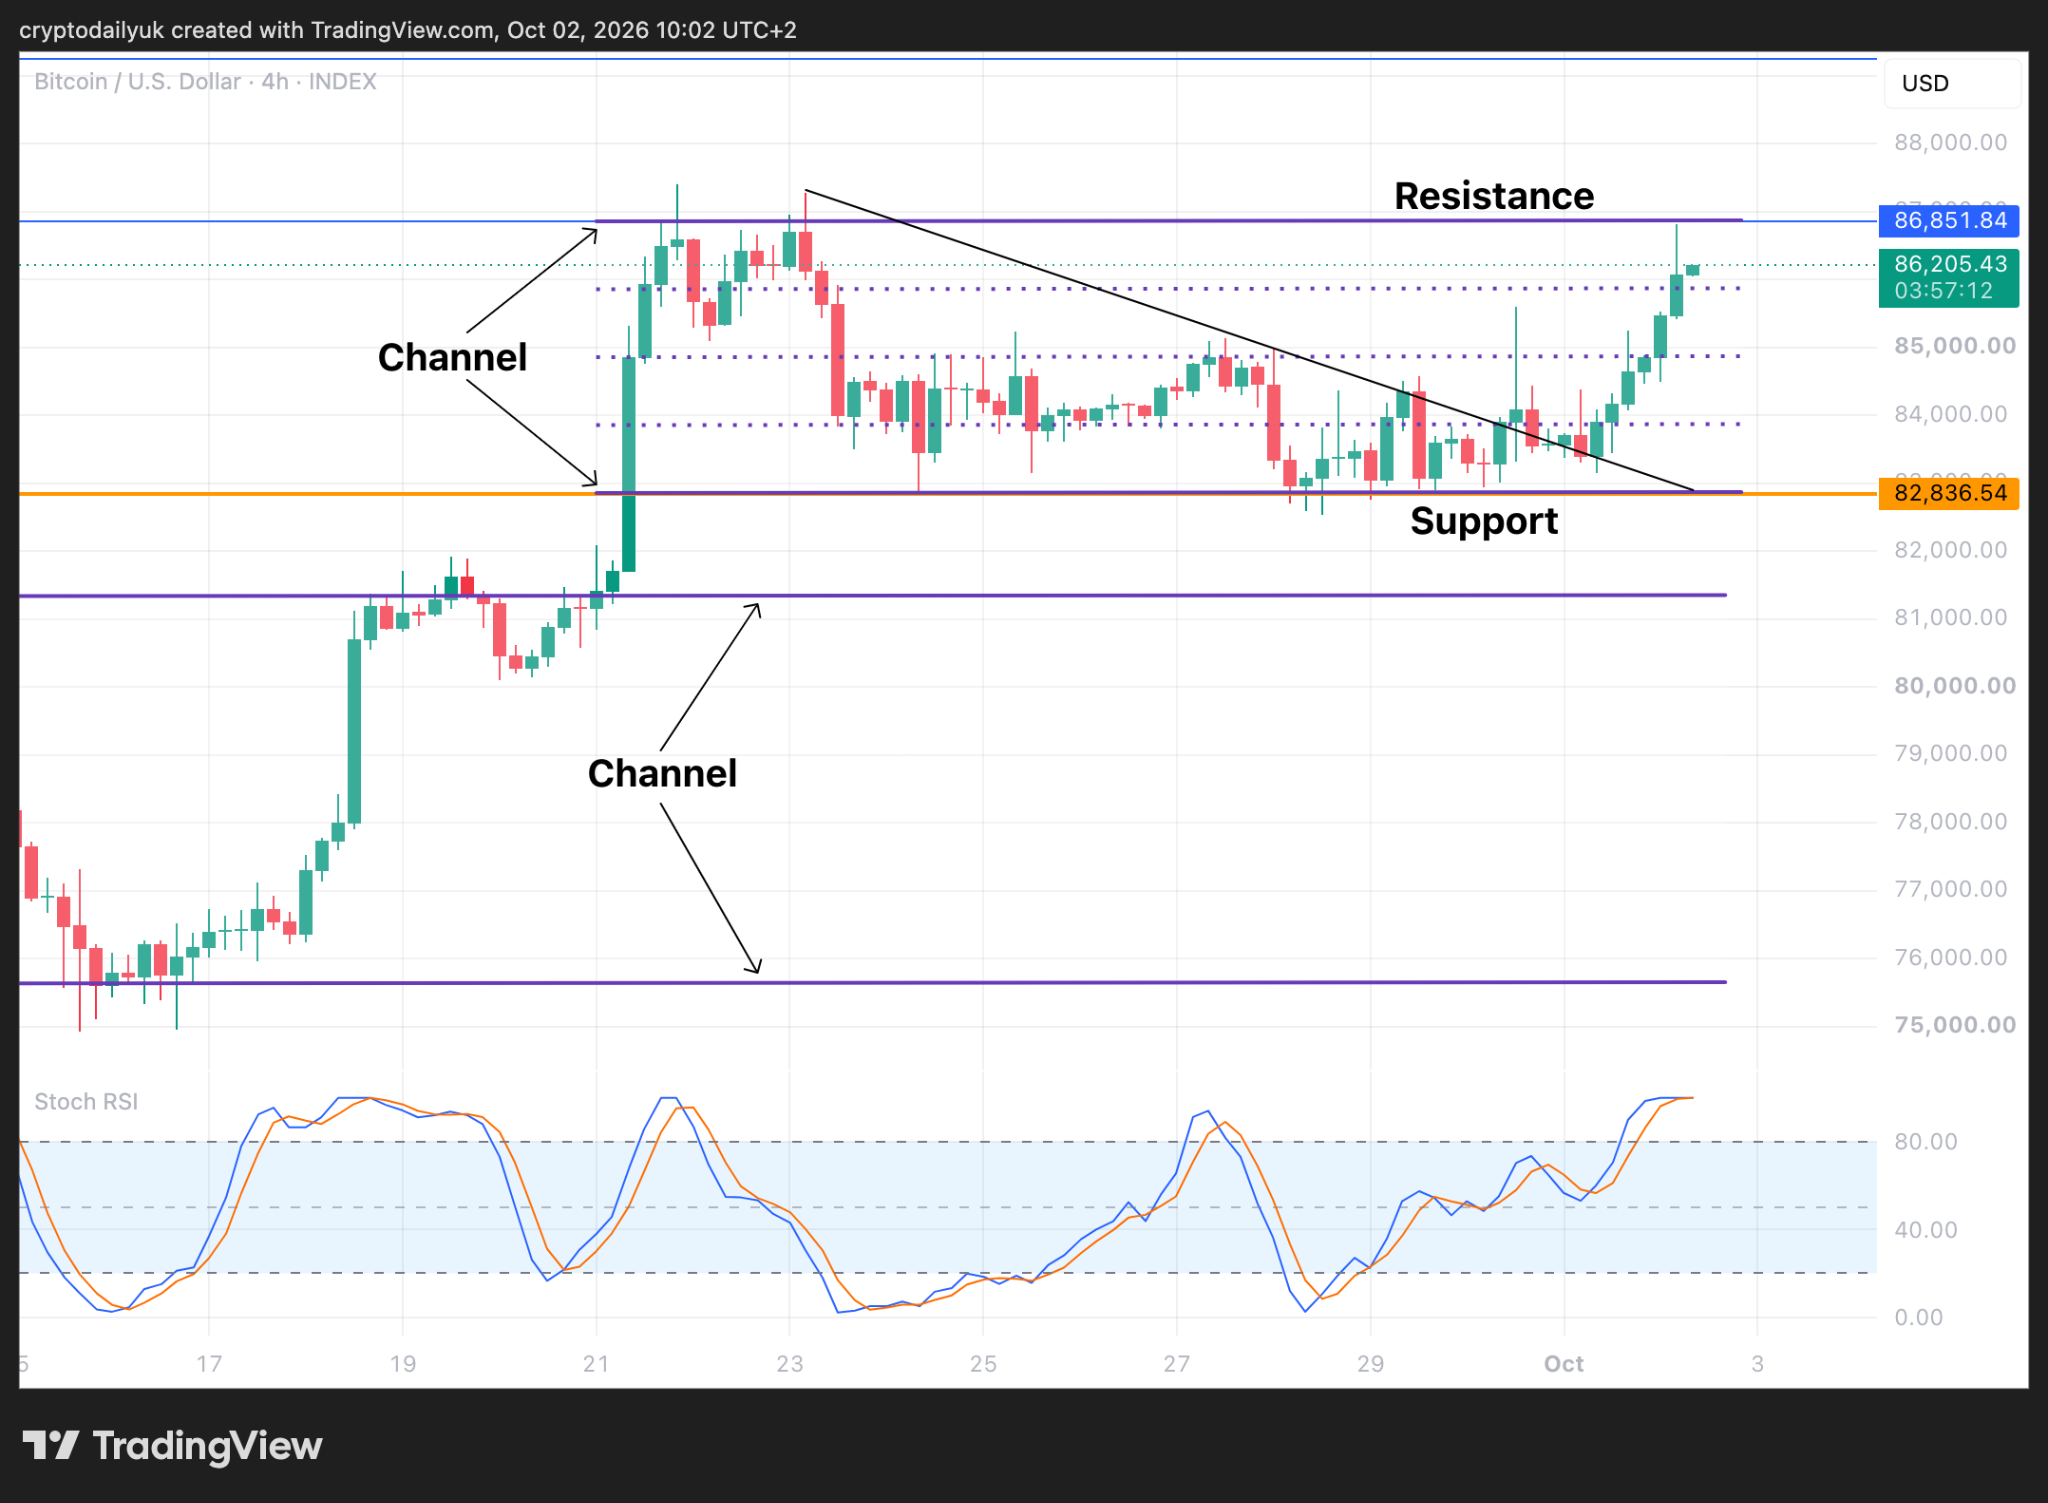
The Bitcoin price rose out of its slumbers on Thursday and increased $3,400 to a price of $86,800. It was at this point that the price was rejected, falling back to $86,000. Was this just the first attempt at a breakout of a parallel channel? Could a confirmed breakout take place on Friday or over the weekend?
$BTC price reaches top of parallel channel
Source: TradingView

The $BTC price was boosted to the upside on Thursday and into Friday after breaking clear of a descending triangle pattern within a parallel channel. Once volume got behind the breakout it was a relatively short amount of time before the price ascended to the top of the channel, where it was rejected – at least for the time being.
As can be seen on Friday morning, the $BTC price is once again heading back to the top of the channel. Will it get there just to receive another rejection, or is pressure starting to build on the top trendline of the channel ready for a potential breakout?
One important factor that the bulls need to take into consideration is that this window of opportunity for a breakout may not be open for long, given that the price is starting to enter an overbought condition.
Remain in channel or breakout?
Source: TradingView
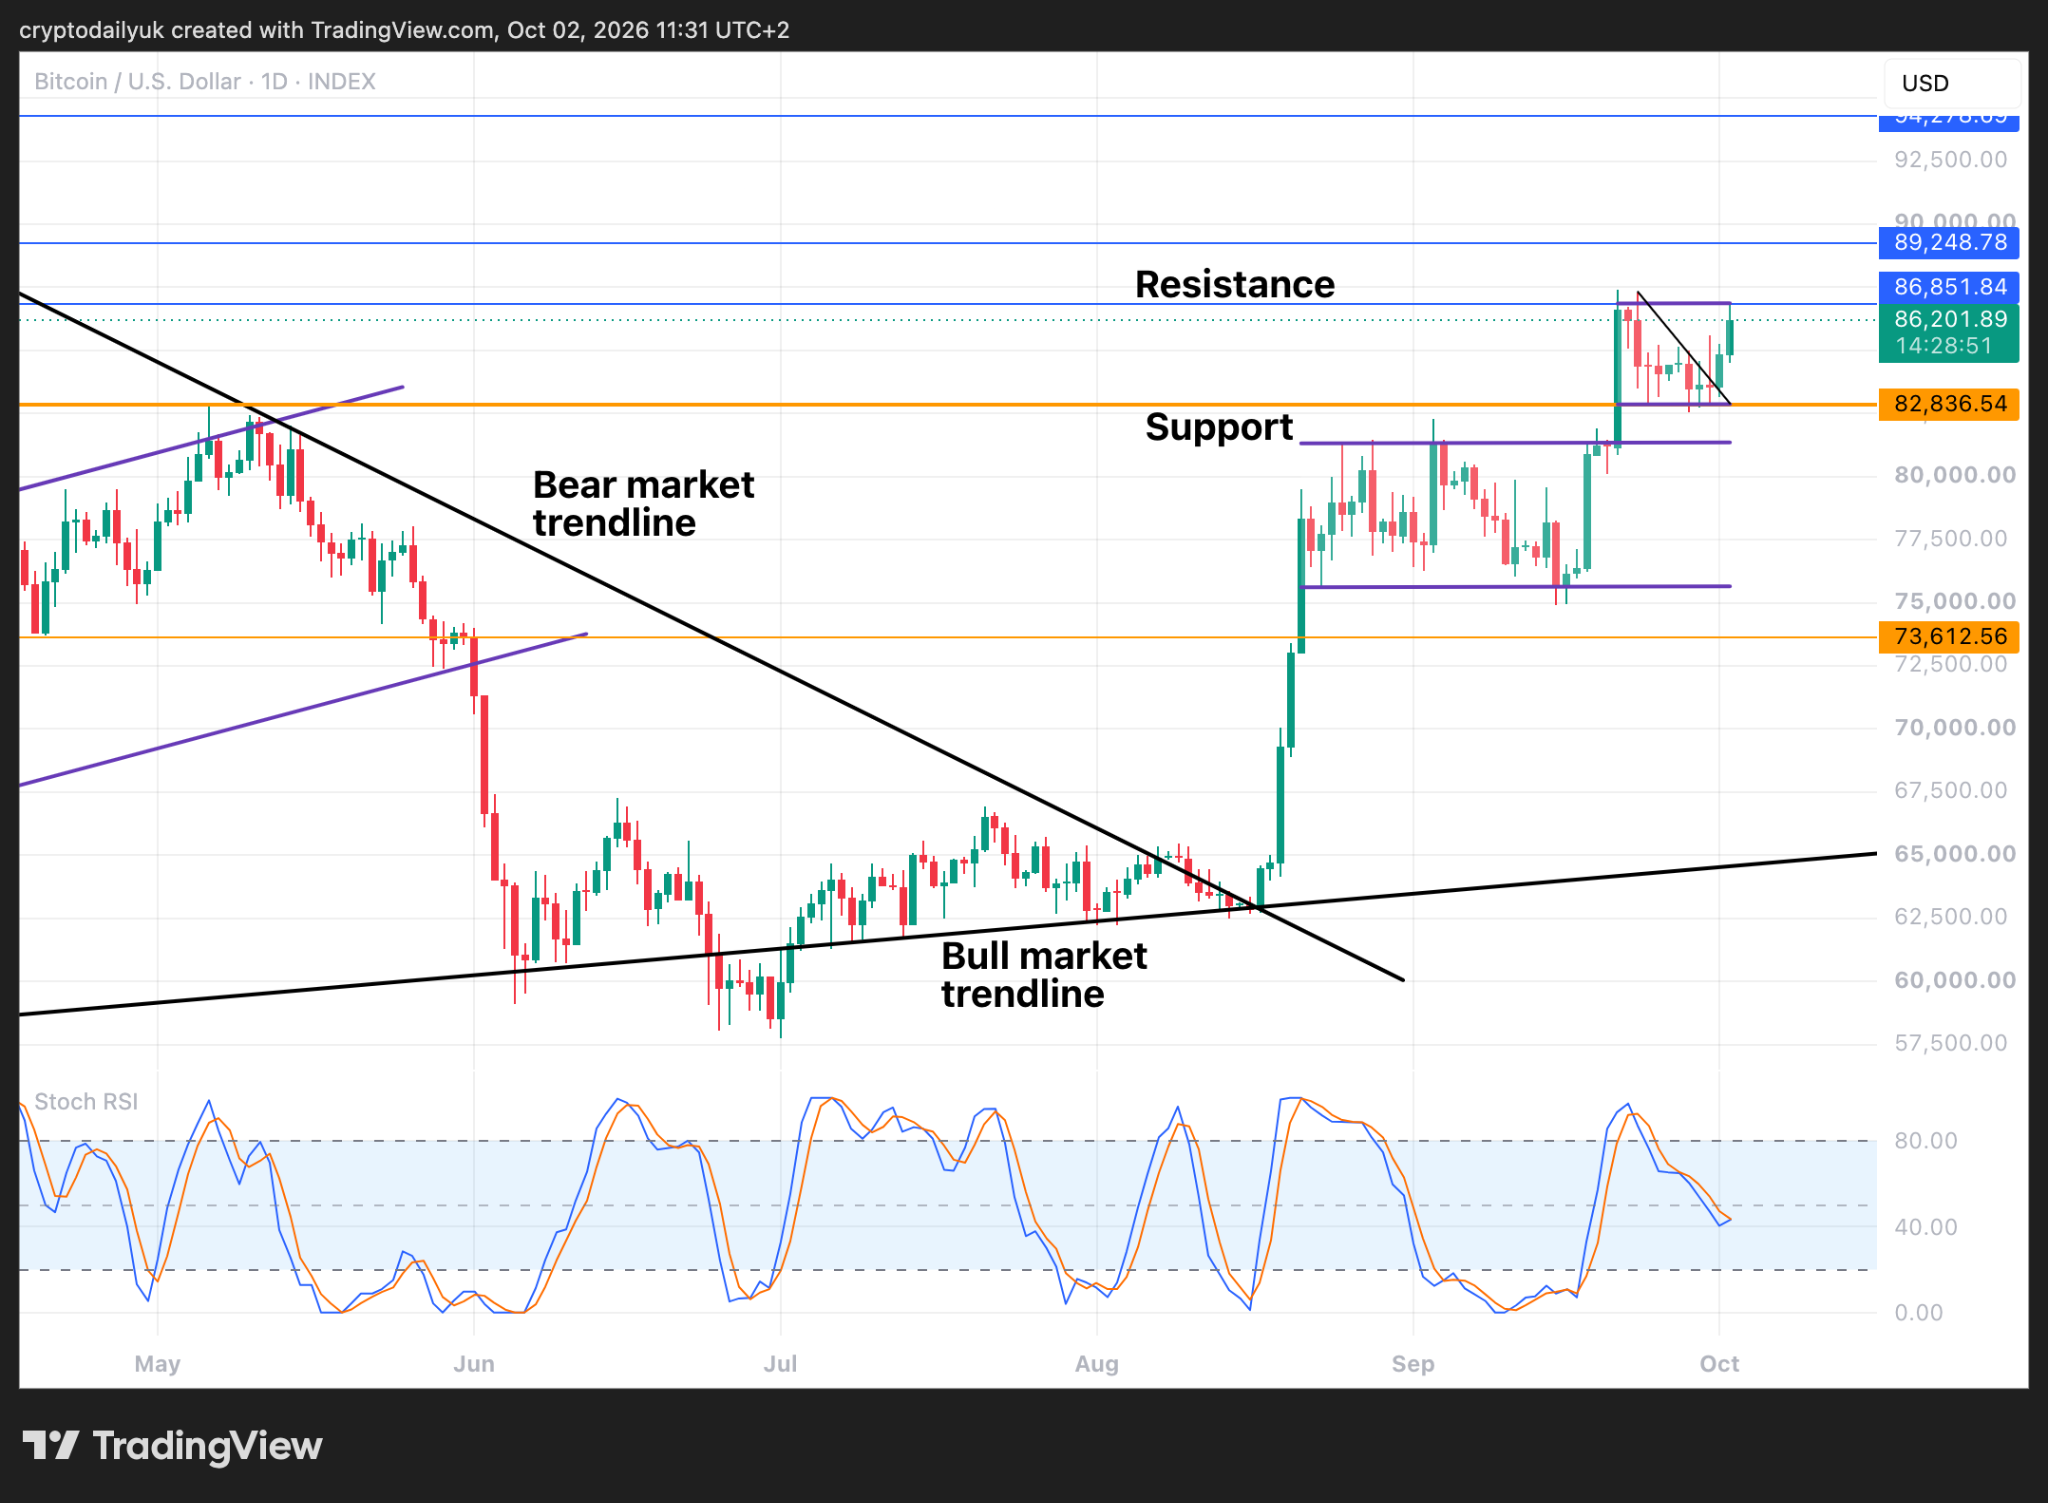
The daily time frame illustrates the clear smaller parallel channel with the descending triangle within it. It may be that the $BTC price does meander some more within the channel. This would probably be a healthier option rather than the direct breakout, given that momentum indicators could be allowed to reset again, potentially leading to a much stronger breakout further down the line.
That said, what will be will be, and if there is a breakout today or over the weekend, the $BTC price could surge into the low to mid $90K region before the next, possibly longer period of consolidation, or even the first decent correction in this so far unconfirmed bull market.
Which resistance level can the bulls reach?
Source: TradingView
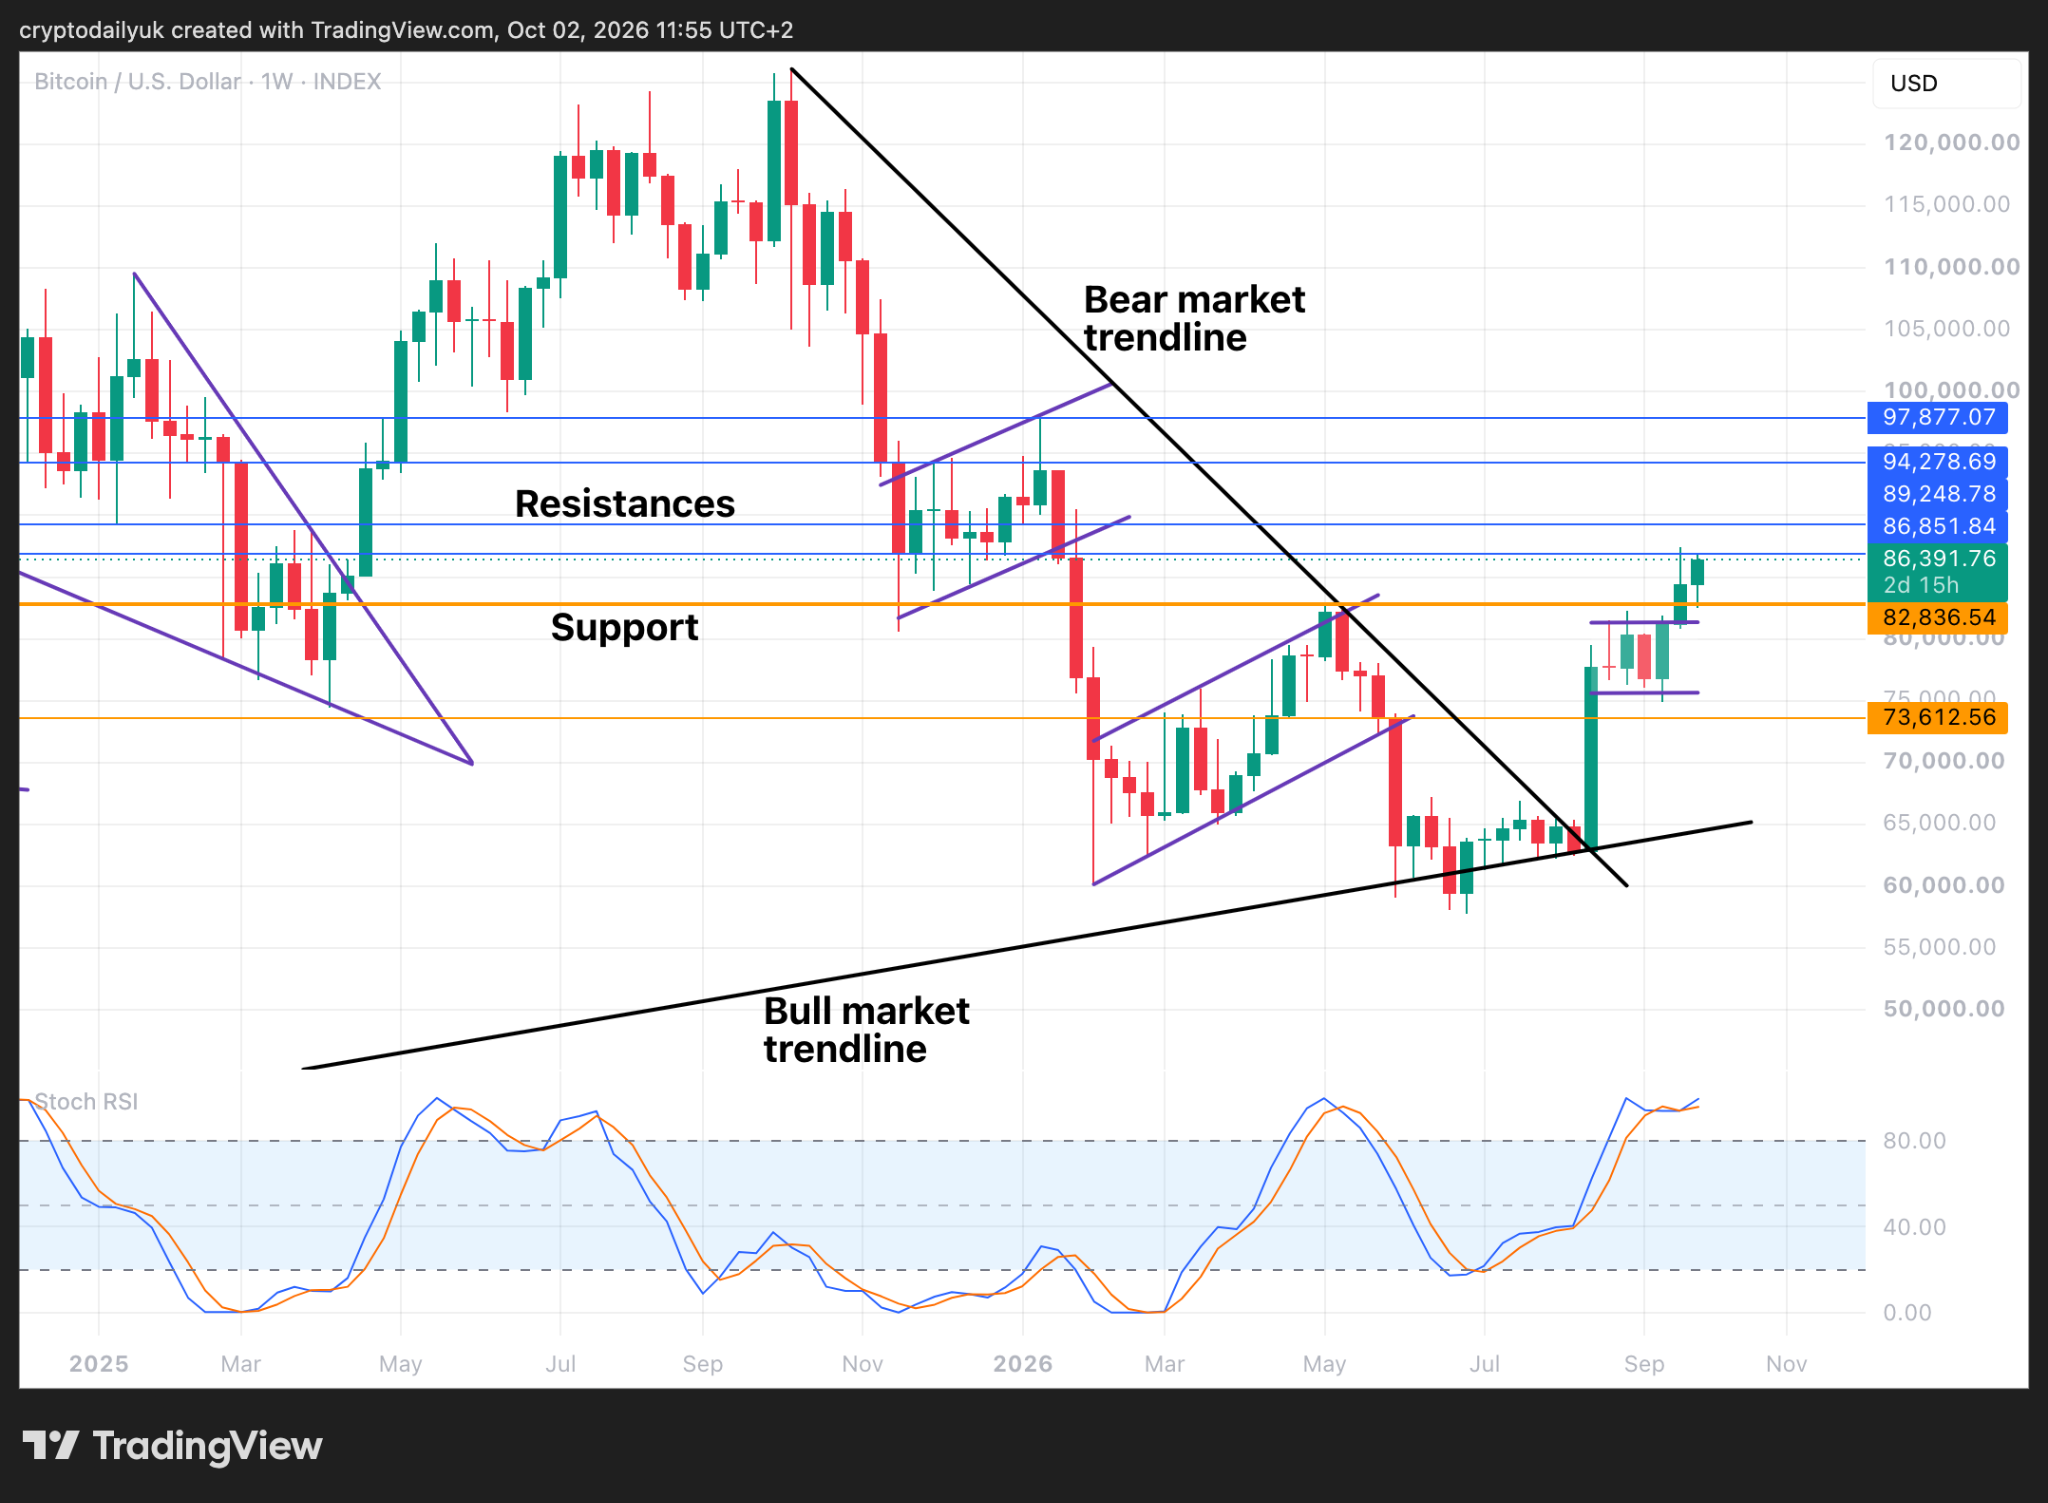
The weekly time frame shows the absolutely to be expected surge out of the bull flag. If the full measured move out of the bull flag is to take place, this rally still has a good way to run.
In fact, if one looks at the price action in this macro-level chart there really isn’t anything untoward throughout the whole of the bear market, the latter stages of the last bull market, and this current bull market. Price has followed each of the patterns and has exited them in the expected direction every time.
Momentum is still with this current rally, although it remains to be seen how far the $BTC price can rise before gravity takes over. The Stochastic RSI at the bottom of the chart has the blue fast line on top of the red slow line once more. This is perhaps signalling one last effort to the upside. While $89,250 is very doable, $94,280 is a much greater level of resistance, with the bull market confirmation level of $97,880 beyond that. Let us see which of these levels this current rally can arrive at.
Disclaimer: This article is provided for informational purposes only. It is not offered or intended to be used as legal, tax, investment, financial, or other advice.





Be the first to comment