



Bitcoin rebounded from the $81,000 area after the latest pullback, keeping the correction contained for now. The more difficult part of the move may come higher up the chart, where the earlier decline began.
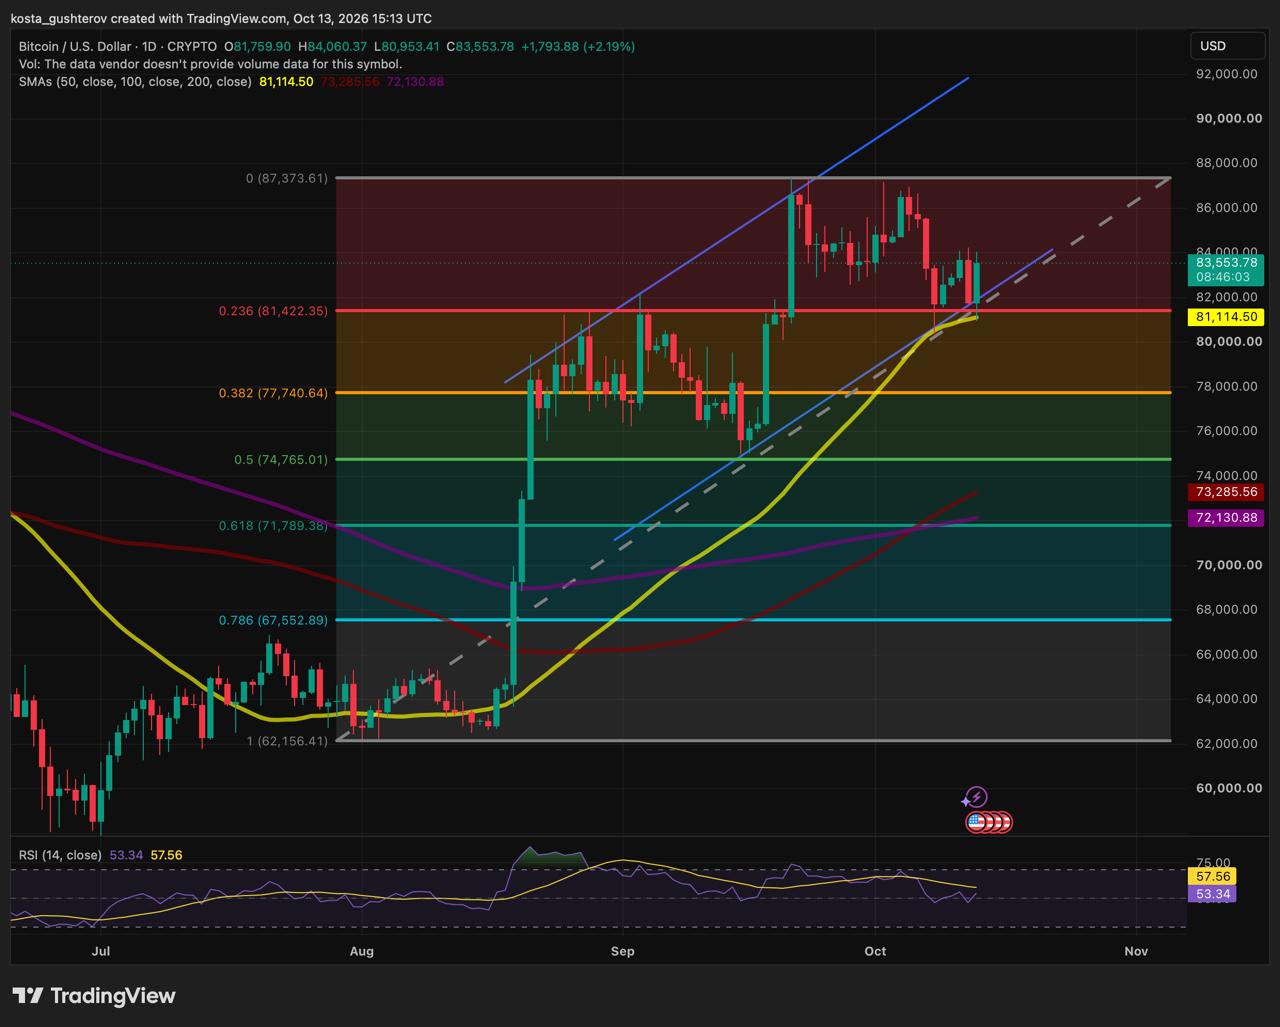
After reaching a recent high near $87,370, Bitcoin fell into the $81,100-$81,400 range. The decline slowed there because the area brought together the 23.6% Fibonacci retracement at $81,420, the rising 50-day simple moving average near $81,115 and the lower side of the ascending structure on the daily chart.
Those overlapping references made the zone more important than a single horizontal price level. Bitcoin traded near $83,550 at the time of writing after falling as low as $80,950, showing that buyers responded before the pullback reached the next Fibonacci level.
The defence keeps the broader daily structure intact, but it has not yet returned Bitcoin to the part of the chart lost during the decline. That task begins around $85,000.
$85,000-$86,000 is the first test for the rebound
The latest bounce needs to move through the $85,000-$86,000 area, where Bitcoin previously stalled after its initial advance. Recovering that range would bring price back into the middle of the recent consolidation and show that the response from $81,000 is developing beyond a short-term relief move.
Only then would the recent high near $87,370 return as the next major reference. Until Bitcoin regains the $85,000-$86,000 range, the chart still shows a market trading between a defended support area and the resistance that capped its earlier recovery.
The wider trend remains constructive, though momentum is less decisive
Bitcoin’s 50-day SMA remains above the 100-day and 200-day averages, while price is still trading above all three. Technical analysts generally view that ordering as constructive because the shorter-term trend remains stronger than the longer-term baseline. The latest pullback tested the 50-day average instead of breaking into the deeper moving-average layer.
Momentum gives a more reserved reading. Daily RSI has returned above its 50 midpoint to around 53, but remains below its signal average near 58. Selling pressure has eased since the drop from $87,000, while the indicator has yet to recover the stronger momentum visible near the recent high.
If $81,000 fails, the chart opens into a lower support sequence
A renewed move below $81,100-$81,400 would bring the 38.2% Fibonacci retracement near $77,740 into focus. That would mark the next support area beneath the range that held during the latest decline.
Below it, Bitcoin’s 50% retracement near $74,760 meets the rising 100-day SMA near $73,280. The 200-day average sits lower, near $72,130. Together, those references form a broader $72,100-$74,800 support region, relevant only if the current defence gives way.
The bounce has held; the recovery still needs confirmation
Bitcoin has preserved the area that kept the pullback shallow, leaving the daily uptrend in place for now. The next meaningful evidence would come from a return through $85,000-$86,000, where the previous advance ran out of momentum.
Until that happens, the chart describes a recovery attempt. The $81,100-$81,400 area remains the line that keeps the correction contained for now.
This article is provided for informational purposes only and does not constitute financial or investment advice. Technical levels and indicators are interpretive tools, not guarantees of future price movement.



Be the first to comment