


Bitcoin (BTC) rose as much as 2% over the past 24 hours to an intraday high of $81,300 on Tuesday. This brings the weekly and 30-day gains to 5% and 21%, respectively.
This rally was accompanied by buying from long-term holders, who have added more than 330,000 BTC over the past month, according to data from CryptoQuant.
Key takeaways:
- Long-term Bitcoin holders added 331,000 BTC over the past 30 days.
- Spot Bitcoin ETFs have seen a total of $1.18 billion in net inflows over the last three days.
- Bitcoin’s bull flag projects a BTC price rally to $94,800.
Bitcoin long-term holders add $26.7 billion in BTC
Bitcoin long-term holders (LTHs) — entities holding coins for at least six months without selling — ramped up their holdings as BTC price hit new highs above $81,000.

Related: Bitcoin short-term cost basis approaches profitability, but $80K must flip to support first
CryptoQuant data shows that on a rolling 30-day basis, the supply held by LTHs increased by a net 331,000 BTC, worth around $26.7 billion at current market prices as of Tuesday. This represents almost 1.6% of the total supply, suggesting increased accumulation as the price recovers.
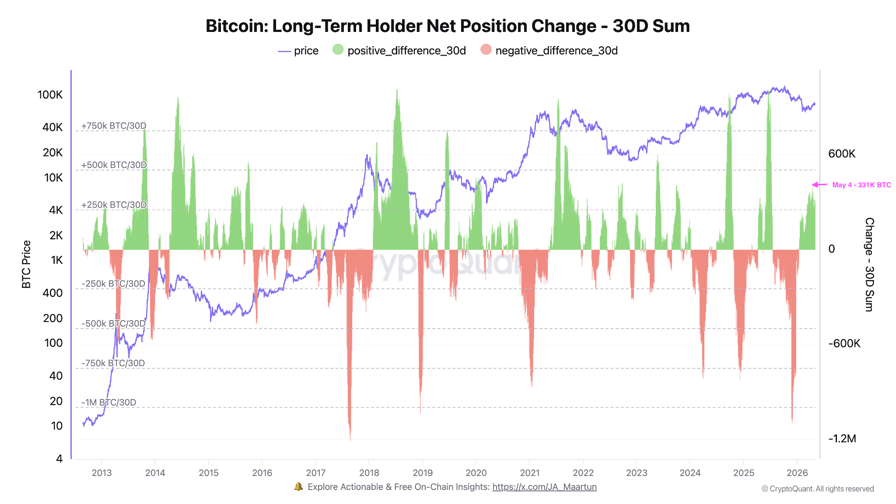
Bitcoin 30-day rolling LTH supply change. Source: CryptoQuant
Also accompanying Bitcoin’s bullishness are strong inflows into US-based spot Bitcoin exchange-traded funds (ETFs), which have recorded positive flows for three consecutive days totaling $1.18 billion.
These investment products attracted $532 million in net inflows on Monday, suggesting increased institutional appetite for BTC.
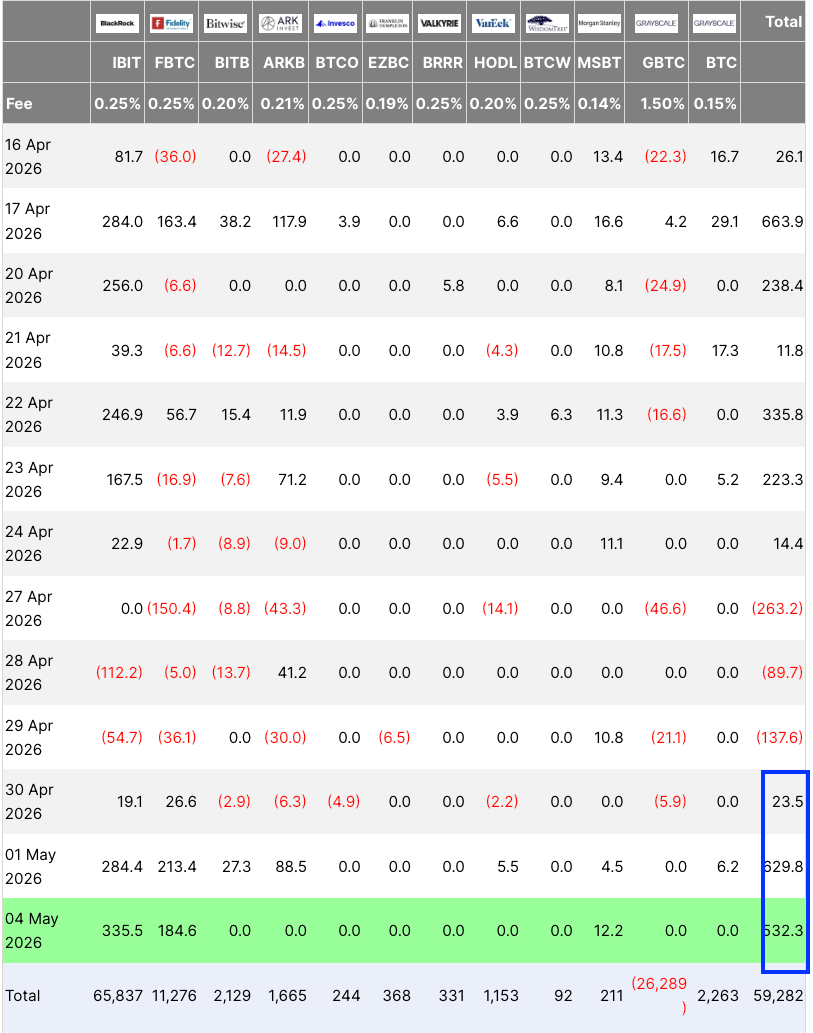
Spot Bitcoin ETF flows table. Source: Farside Investors
“ETF flows are back in the markets, and the markets are turning upwards for Bitcoin,” MN Capital founder Michael van de Poppe said in an X post on Tuesday, adding:
“I assume we’ll continue to see more strength coming in over the course of the next few weeks as there’s a lot of ETF demand happening.”
As Cointelegraph reported, institutions are absorbing more than five times the daily mined BTC supply.
How high can Bitcoin price go?
The Bitcoin liquidation heatmap showed the price eating away liquidity around $80,000, with millions in bid orders still sitting between the spot price and $84,600.
“Bitcoin is on a liquidity hunt,” Bitcoin analyst AlphaBTC said his latest post on X, adding:
“Up to $84K is looking Juicy!”
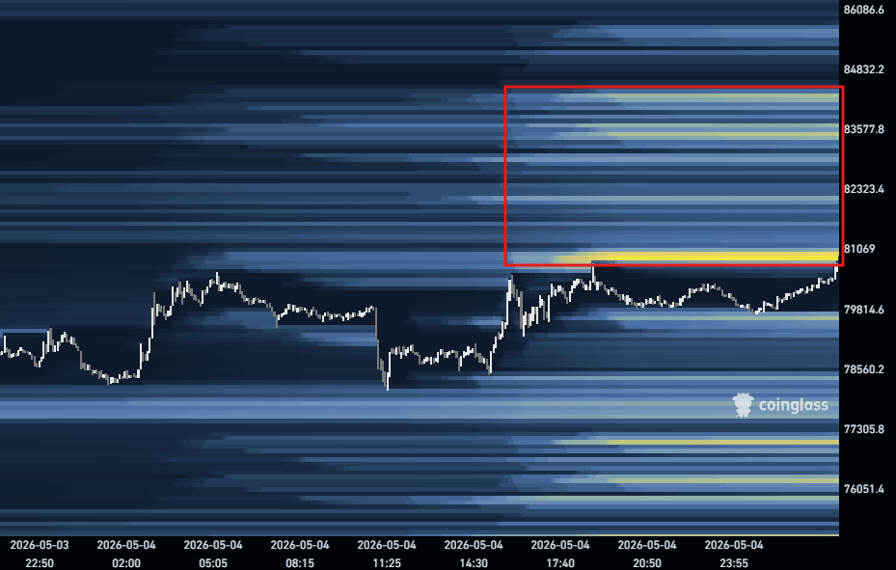
Bitcoin liquidation heatmap. Source: Glassnode
The $84,000 area is on many traders’ radars because it coincides with the CME gap formed in early February. From a technical perspective, the price has validated a bull flag on the daily chart after breaking above the upper boundary at $77,500.
A daily candlestick close above the 200-day exponential moving average at $$82,000 will confirm the continuation of the uptrend toward the measured target of the flag at $94,800. Such a move would bring the total gains to 18%.
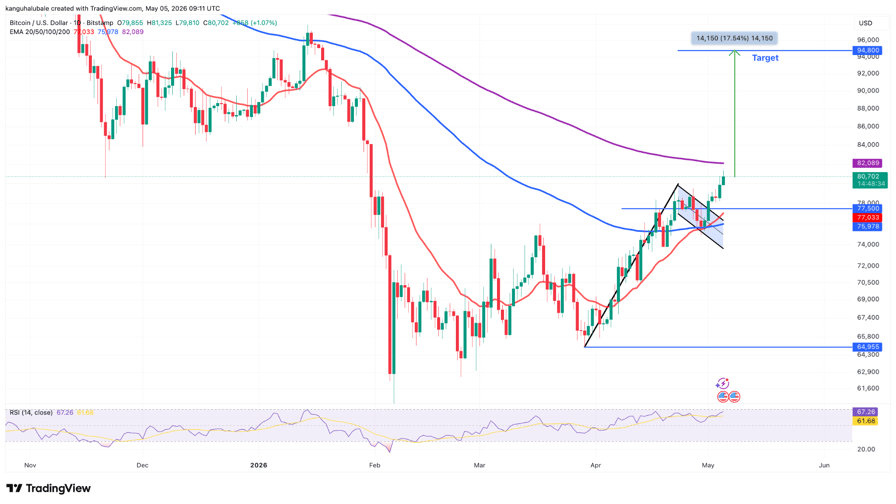
BTC/USD daily chart. Source: Cointelegraph/TradingView
Crypto investor Cryptocupra shared a chart suggesting that Bitcoin’s macro bottom could be in, following the bullish cross from the weekly MACD, paving the way for more upside.
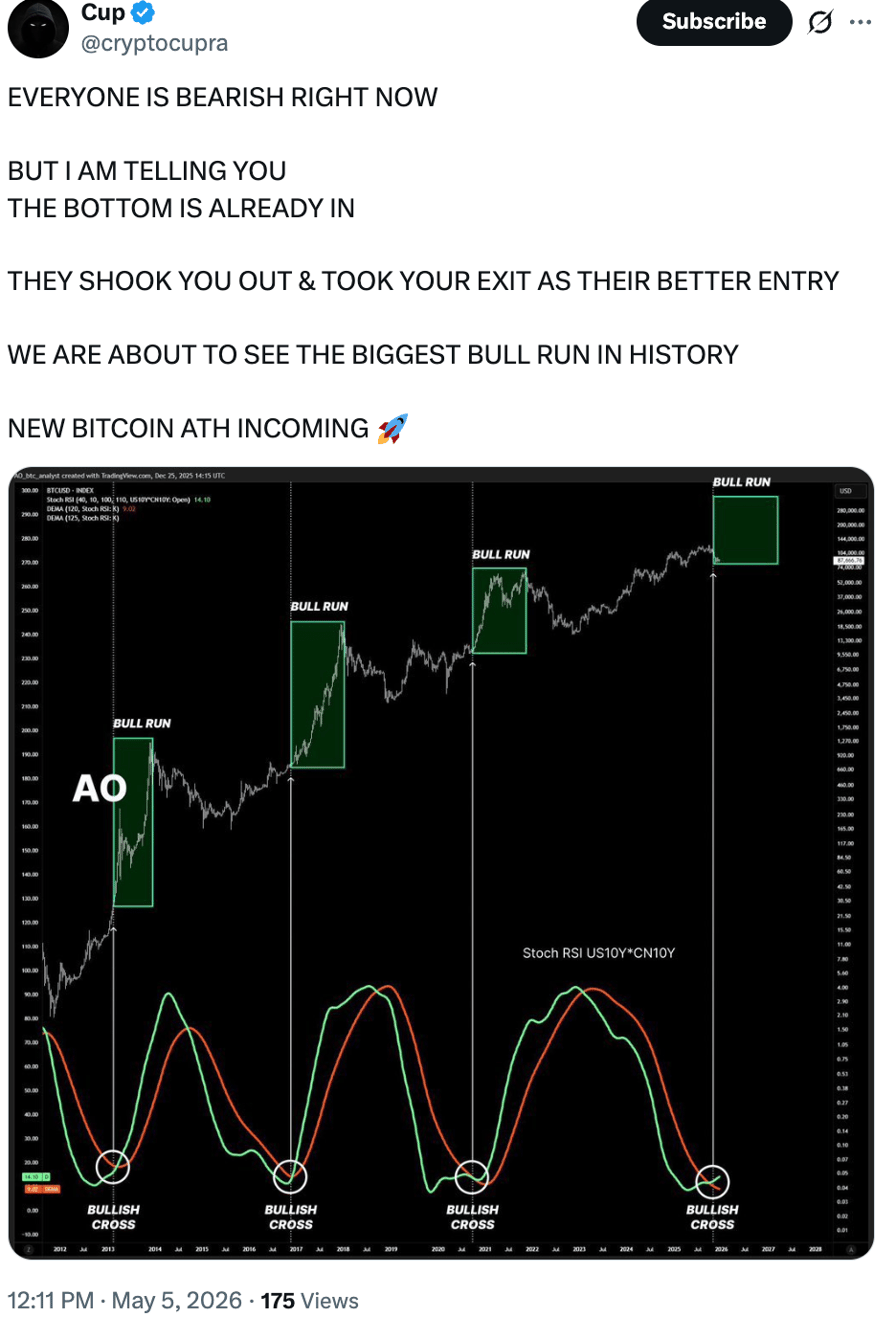
BTC/USD weekly chart. Source: X/Cryptocupra
As Cointelegraph reported, the BTC/USD pair may rise as high as $92,000 if the resistance at $84,000 is broken.

Be the first to comment