



Bitcoin price is facing renewed selling pressure after it failed to breach an important resistance level in the range of $81,000-$83,000, and its next direction is being closely monitored.
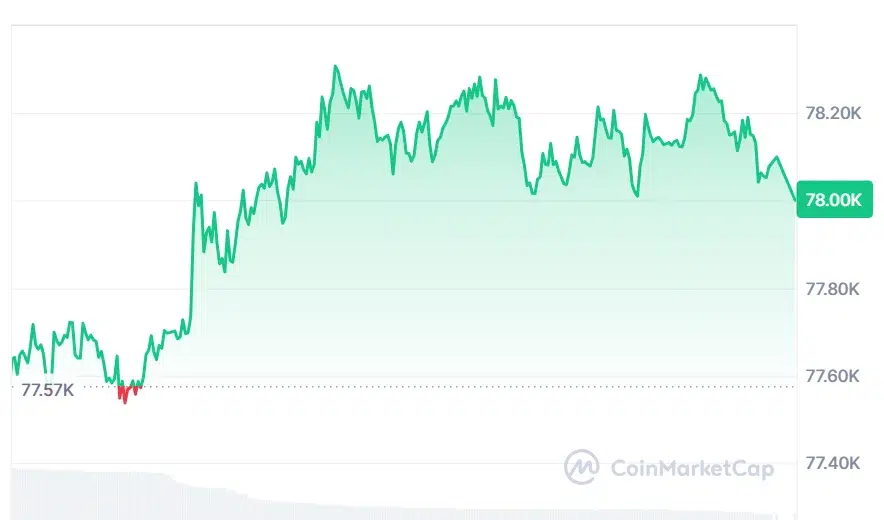
At the time of writing, BTC is trading at $78,002, with a 24-hour trading volume of approximately $45.10 billion and a market capitalization of $1.57 trillion. BTC has gained 0.61% over the last 24 hours.
Bitcoin Rejected at Resistance as Bears Regain Control
On August 30, crypto analyst Crypto Patel stated that Bitcoin has rebounded from the $81,000-$83,000 higher timeframe resistance area, which was already marked as a major supply zone. In his words, the last daily candlestick formed a decisive downward move after rejection at this area.
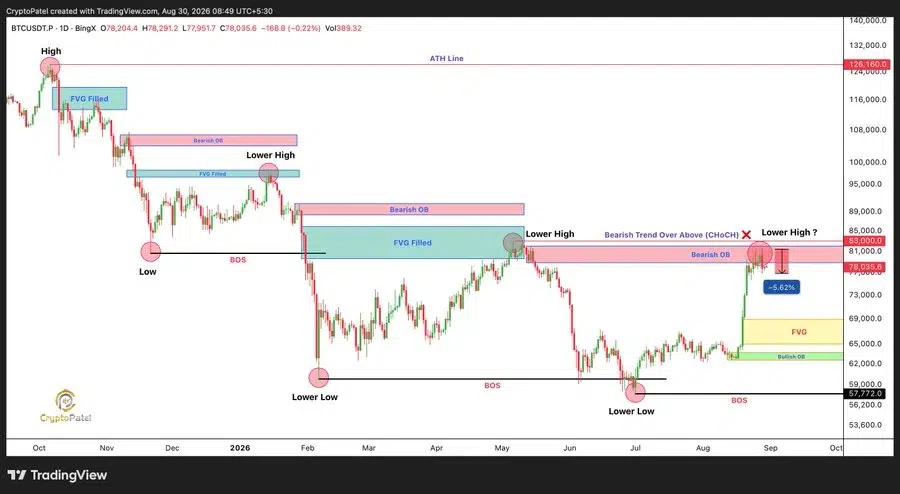
This means that the bulls have not yet managed to take a sustainable stand above the $83,000 level. Considering the SMC and ICT approach, the $81,000-$83,000 zone is still a significant supply zone, while $83,000 is a major level that may invalidate the bearish scenario.

Also Read | Stablecoins Face New BIS Warning Over Large-Scale Payment Use
Bitcoin Faces Key Support Battle
With Bitcoin price approaching $78,000, the area has become a major point of battle. An effective hold might help give buyers another chance to take on resistance, but a break below could lead to further selling of the cryptocurrency.
According to Crypto Patel, there is a downside target of $50,000-$55,000 in case of a breakdown in support for the cryptocurrency. He also believes that a bullish reversal will only be regarded as valid if BTC manages to cross $83,000.
This creates a clear setup for the market. Bitcoin may either make a recovery and retest the $81,000-$83,000 area or fall through nearby support and head lower again.
Technical Indicators Still Show Buying Strength
Although there is a rejection at resistance, the overall technical outlook for Bitcoin has not shifted to a bearish one.
BTC is above the middle line of the Bollinger Band, which is roughly at $71,731. The upper line of the Bollinger Band is placed at $85,866 and acts as an area of resistance if the price rises again.
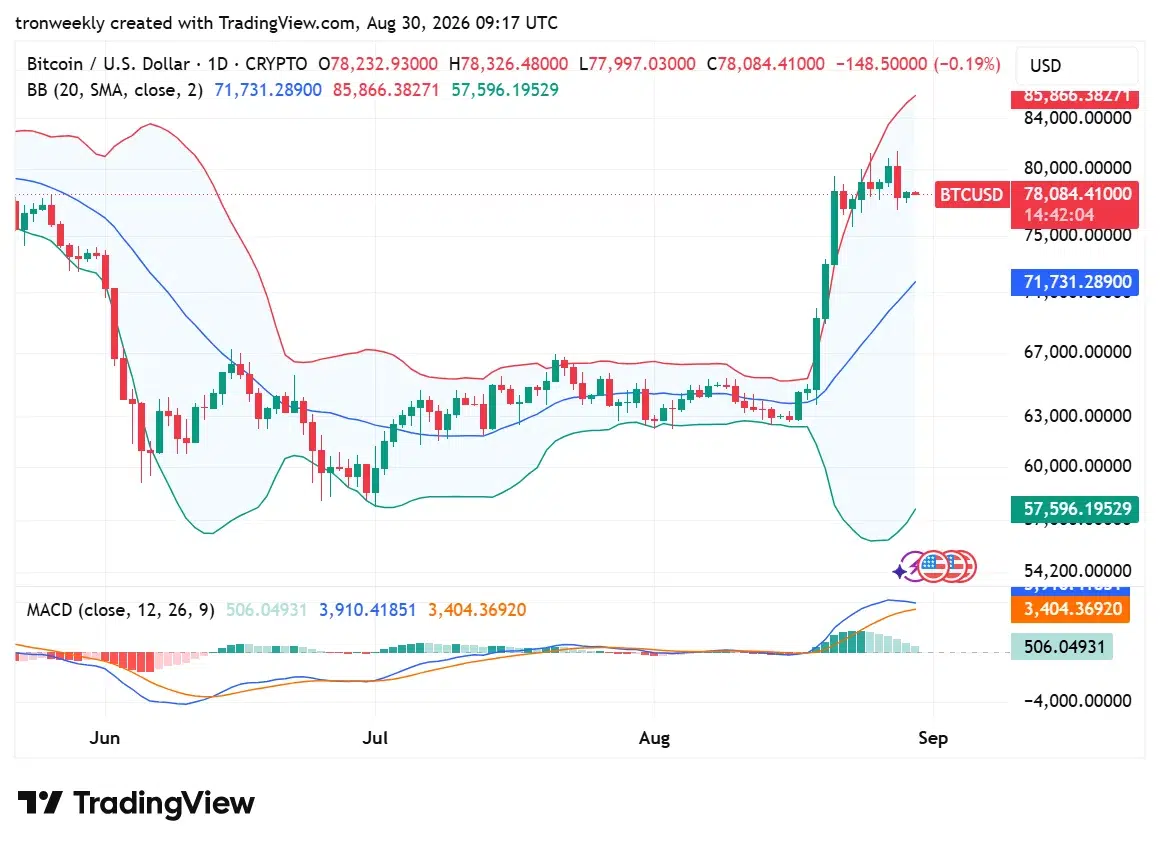
Moreover, the MACD indicator is still positive. In particular, the value of the MACD line is 3,910, while the signal line has the value of 3,404, and the histogram stays positive around 506. This means that buyers are still in control of short-term momentum.
At the same time, the decrease in the size of MACD histogram candles signals slowing momentum. If this continues, Bitcoin price will find it hard to break out from the upper resistance level.
What Happens Next for Bitcoin Price?
The next big move for Bitcoin price is going to be contingent on the price action in relation to $78,000 and whether or not buyers can make an assault on $83,000.
If current support is held along with sustained momentum, it might be possible that BTC will make another go at the $81,000-$83,000 range.
However, further rejection accompanied by a breakdown of the bottom support will reinforce the bearish situation, as seen by Crypto Patel, with the need for greater liquidity being a key factor.
Meanwhile, the market is still stuck in the conflict between bullish momentum and an important resistance zone on higher timeframes. The move near $78,000 and $83,000 will reveal the direction of the coin.
Also Read | Trump Digital Gold Token Crashes 99% After X Promotion
This article contains market analysis and price predictions. These are not guarantees. Crypto markets are volatile. Always DYOR. Not financial advice.


Be the first to comment