



What to know:
- Bitcoin price tests key support zone amid ongoing market-wide correction.
- Strong confluence support formed by SMA, Fibonacci, and channel structure.
- Breakdown below support could trigger a move toward lower accumulation levels.

Bitcoin price stayed pressured, as the BTC stayed close to an important support level amid significant declines in the whole market.
At the time of writing, BTC is trading at $72,773 with a 24-hour trading volume of $54.91 billion and a market capitalization of $1.46 trillion. The Bitcoin price also recorded a 3.16% drop over the last 24 hours, increasing concerns about short-term market weakness.


Source: CoinMarketCap

Also Read | Dogecoin Holds Near $0.10 as Traders Watch 200 EMA
Bitcoin Faces Major Test at Strong Support Level
While the current market correction has taken place, there is still one very important level of support that will define the future trend of the price of Bitcoin. On May 28, 2026, a popular crypto analyst, Ali Martinez, highlighted that Bitcoin has reached one of its most important support zones by hitting the bottom side of an ascending channel.
According to Martinez, this is turning out to be one of the most crucial areas because many technical levels are now matching. The lower level of the channel is currently matching the 100-day SMA and the 23.6% Fibonacci retracement level. This forms a very significant structure in terms of support in the range $73,000 to $71,300.

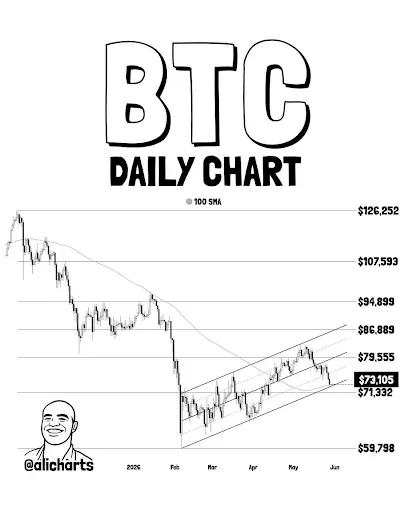
Source: Ali Martinez’s X Post
Martinez added that should the buyers be able to defend the support zone, there could be a gradual rise in Bitcoin prices back towards the $77,000 and $79,500 resistances in the subsequent trading sessions. On the other hand, should the $71,300 level break down, further selling could ensue.
Further on, Martinez said that a brief drop below the existing support level would aid in eliminating any speculative trading in the markets. In this case, the Bitcoin price would open an accumulation window nearer the February support base around $60,000.
Bitcoin Price Momentum Turns Bearish
There is also a clear weakening by technical indicators regarding the Bitcoin price in the near term. For example, the RSI is down to 33.27 from above the average of 44.73, suggesting buying pressure is fading, whereas sellers continue dominating the trend of the market.
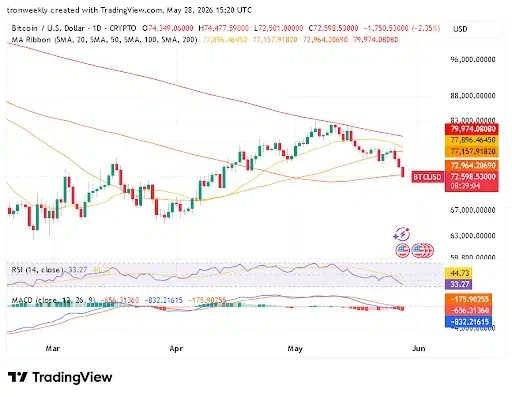

Source: TradingView
The Moving Average Convergence Divergence (MACD) further reaffirms the bearish stance on the price of Bitcoin. The current level of the MACD line stands at -832.21 and continues to remain below the signal line of -656.31. Furthermore, the histogram level is also negative at -175.90.
Considering the current state of Bitcoin at a critical support level, the coming trading days will be crucial for it. A successful defense by buyers can restore stability in the market, while any negative development might take Bitcoin towards corrective levels.
This article contains market analysis and price predictions. These are not guarantees. Crypto markets are volatile. Always DYOR. Not financial advice.
Also Read | Bitcoin Price Holds $75K Support as BTC ETF Outflows Continue


Be the first to comment