




Bearish pressure does not seem to be fading soon, and XRP has been on a downward trend over the past weeks, breaching the $1.30 support level on Thursday. As a result, heightened volatility has taken over the trading activity on cryptocurrency exchanges, especially on the Binance platform.
XRP Volatility On Binance Keeps Traders On Edge
After XRP’s persistent negative price action, the pressure is now being felt across cryptocurrency exchanges across the sector. However, in this scenario, Binance, the largest crypto exchange in the world, continues to stand out as the most impacted trading platform by this bearish performance.

As traders navigate erratic market conditions and fluctuating momentum, trading activity related to XRP on Binance continues to be extremely volatile. While Binance’s trading activity sees heightened volatility, the price of XRP was stabilizing near the $1.30 level at the time of the post.
Looking at the XRP Perp-Spot Volume Imbalance Z-Score, the metric has now reached 0.54, along with the Z-Score indicator rising to nearly 0.95, which reflects a noticeable increase in activity relative to previous averages. With this, uncertainty is building across the market, which poses a risk of a further corrective phase.
The volume imbalance positioning at around 0.54 indicates that trading volumes in perpetual contracts have become significantly higher compared to past periods of normal activity. This trend signals an increase in traders entering short-term positions and a rise in leverage usage.
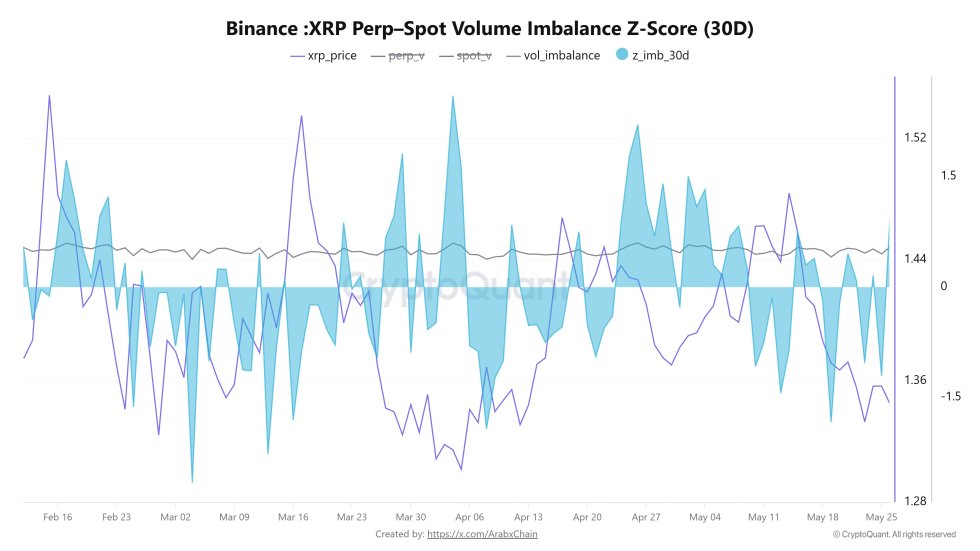
A reading of this kind is not considered low, but it points to a market that has started to experience stronger activity in comparison to previous moments of relative calm. As for the Z-Score value nearing 0.95, Arab Chain highlighted that this implies that the current activity has become higher by nearly a full standard deviation compared to its usual average.
Furthermore, this positioning indicates that the market is beginning to exit its normal balance state and move into a phase of unusual activity when compared to previous periods. When this Z-Score value moves closer to 1 or exceeds it, the current momentum strength becomes more pronounced and impactful.
Traders Returning To Speculative Activity
Data show a persistent move into the negative zone prior to the metric’s recent return to the positive zone, indicating a steady improvement in risk appetite. It also underscores the return of traders to speculative activity after a period of calm or reduced market participation.
In contrast, Arab Chain noted that XRP’s price has not yet moved with the same intensity as the indicator, as it remains close to the $1.34 to $1.45 range for most of the observed period.
At the time of writing, XRP was trading at $1.31 after falling by over % over the past day. Despite ongoing waning price action, CW reported that buying of long positions is appearing following the short closing. This is a sign that real upward pressure is emerging and is increasing further.
Featured image from Free3D, chart from Tradingview.com
Editorial Process for bitcoinist is centered on delivering thoroughly researched, accurate, and unbiased content. We uphold strict sourcing standards, and each page undergoes diligent review by our team of top technology experts and seasoned editors. This process ensures the integrity, relevance, and value of our content for our readers.


Be the first to comment