


Bitcoin recently encountered a well-known issue: rejection at the 50 EMA. The idea that the current move is still corrective rather than a confirmed trend reversal is strengthened by the fact that Bitcoin failed to break through after pushing toward the $75,000 mark, and is now retreating.
Bitcoin’s deterministic movement
The reason is explained by the structure. Bitcoin is trading inside a rising triangle or wedge, printing higher lows, but finding it difficult to generate significant higher highs. Every upward push is being capped close to dynamic resistance, especially the 50 EMA (blue line) — which has served as a reliable rejection zone ever since the larger downtrend started.
This level is not arbitrary; rather, it represents the intersection of macro resistance and short-term momentum.

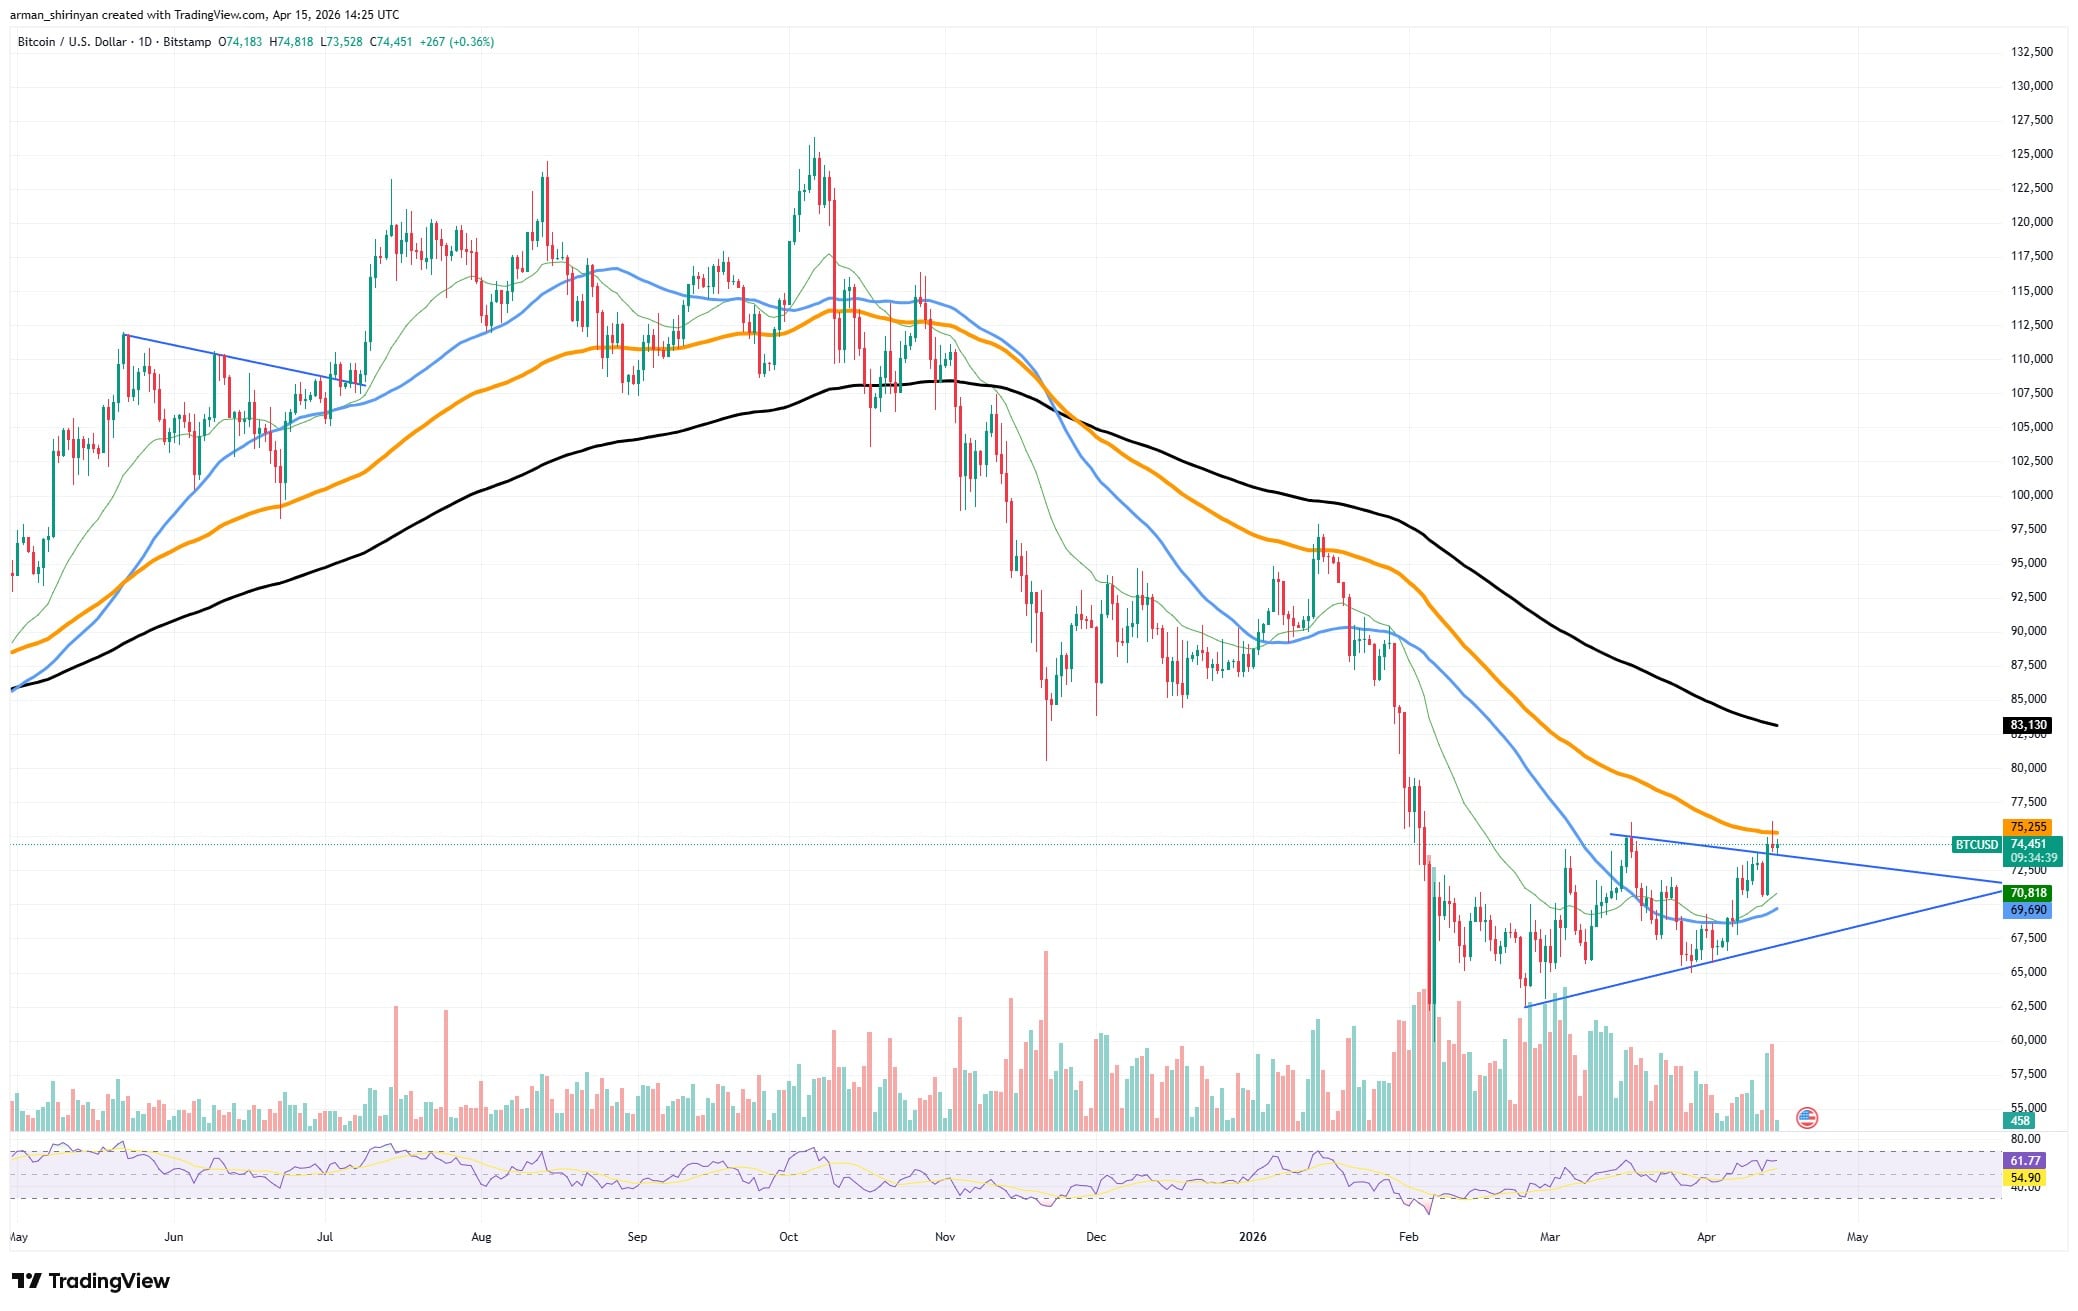
The failure is important. The first indication of a possible trend change is frequently the 50 EMA. Momentum usually picks up speed when the price reclaims and stays above it. However, repeated rejections, such as the one close to $75K, show that sellers are actively defending that level and buyers are still lacking conviction.
Volume makes the problem worse. Although there has been a rise during upward trends, it has not been significant enough to support a breakout. Rather than expanding, rallies are being absorbed.
A bullish scenario: strong volume and a daily close above the 50 EMA are necessary for Bitcoin to make a clear break above $75,000-$76,000. As momentum traders intervene and short positions unwind, that would invalidate the current rejection pattern and pave the way toward $80,000.
You Might Also Like

A bearish scenario is currently more likely. BTC will remain within the structure if resistance is not broken. The higher low pattern will break, and Bitcoin will probably rotate back toward $65,000-$62,000, where stronger demand previously appeared, if the price drops below the $70,000-$69,000 support zone.
XRP’s silent recovery
Even though XRP is still trading under strong resistance, it is quietly forming what could turn out to be an early-stage uptrend, while the majority of attention is focused on volatile assets or large-cap moves.
XRP is currently below all major moving averages, at $1.35-$1.38, and the overall trend is still technically bearish. Higher lows form along an ascending support line after a protracted period of decline, according to the chart. This is the kind of gradual base-building that frequently precedes more forceful moves, but it is not explosive price action.
Liquidity is the crucial element in this situation. In comparison to earlier cycles, XRP’s trading volume has been comparatively low. Price movement in low-liquidity environments only requires steady pressure in one direction, rather than large inflows.
Resistances are thin
The situation is evolving at the moment. Although still present, sellers are no longer driving the price to new lows, particularly in the vicinity of declining resistance.
Resistance is still well-defined, though. Upside attempts are still limited by the moving averages above and the downward-sloping trendline. As a result, the price is essentially squeezed between rising support and falling resistance in a compressed structure.
Things get interesting at that point. Such markets do not remain compressed indefinitely. Breakouts often occur more quickly and aggressively than anticipated when liquidity is low and the structure tightens.
You Might Also Like

In the case of XRP, a move above the $1.45-$1.55 range would probably cause sentiment to change, attracting momentum traders and forcing short positions to unwind.
Investors should be prepared for early positioning risk rather than instant confirmation.
To advance here, XRP does not require solid fundamentals or a significant narrative change. A structural break is necessary. And because there is little liquidity and low expectations, that move might occur sooner than most people think.
Zcash flows flip
Zcash is quietly picking up steam, and the most recent flow data indicates that something is changing underneath.
Even though price action is still largely under control, a significant rise in futures and spot net inflows at certain intervals, with triple-digit percentage spikes, suggests that fresh capital is entering the asset.
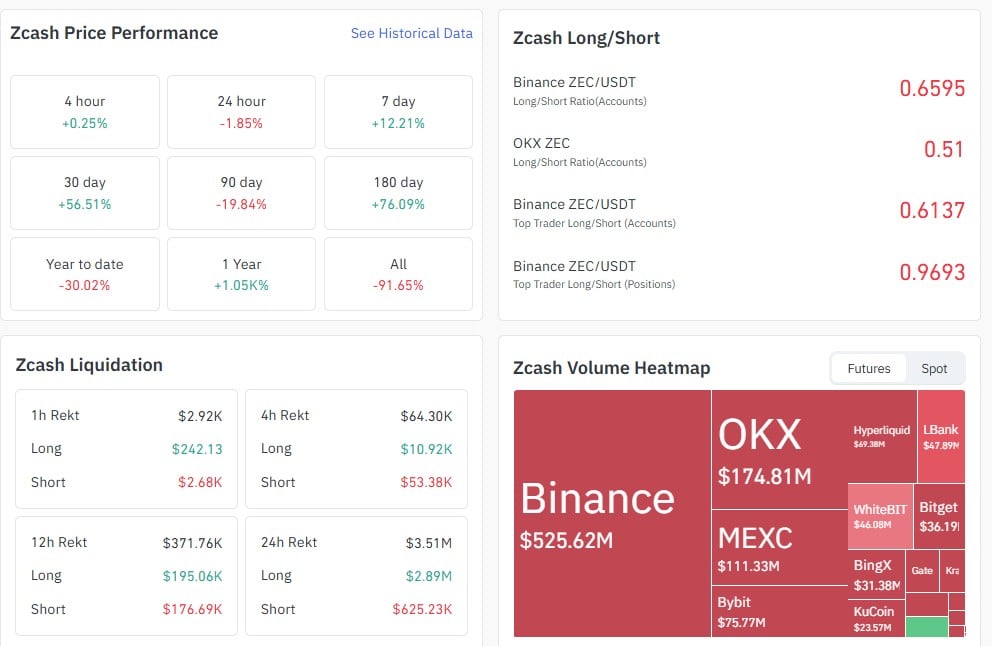
Currently trading between $350 and $360, ZEC is pushing into a local resistance zone and recovering from its recent lows. The price has recovered short- and midterm moving averages, and momentum indicators are trending higher, indicating a clear attempt at a reversal following a protracted downtrend.
Not as bad as it looks
Although a complete trend reversal has not yet occurred, the structure is no longer entirely negative.
Currently, flow dynamics are the primary driver. Net inflows have significantly increased across futures markets, according to data, with some time frames showing growth in flow metrics of over +160%. Additionally, spot flows are positive, suggesting that real capital is being invested in the asset rather than just leveraged speculation.
Liquidation data, on the other hand, reveals a reasonably balanced market, with no extreme wipeouts distorting positioning.
But there is a paradox that should be noted. Open interest and overall volume have decreased on some exchanges despite inflows, indicating that although new capital is coming in, overall participation is still uneven. As a result, there is a risk of price fluctuations, but sustainability is not assured.
Positioning information also tends to be cautious. The lack of a strong bullish skew in long/short ratios indicates that traders are not yet fully committed to an upward continuation. This is consistent with the chart, which shows that ZEC is rising but remains below significant long-term resistance levels.

Be the first to comment