


Bitcoin’s push above $85,000 ended in a quick reversal. The jump came as softer-than-expected US inflation data briefly eased concerns about another Federal Reserve rate hike.
Key Takeaways
The August personal consumption expenditures report arrived on September 30 around 12:30 UTC. Bitcoin briefly climbed above $85,000, then slipped back below $84,000, according to CoinDesk’s intraday coverage. The initial buying was not enough to sustain the move.
Softer inflation eased rate fears, but did not settle them
Core PCE, which excludes food and energy, rose 0.2% in August and 3.0% from a year earlier. The annual figure was below the 3.3% forecast reported by The Wall Street Journal. Headline inflation, including food and energy, came in at 0.3% for the month and 3.4% annually.
For Bitcoin, the immediate attraction was a reduced risk of another rate hike. Higher interest rates raise borrowing costs and can make interest-paying savings more attractive than assets such as Bitcoin. A softer inflation reading can give the Fed more room to pause.
The comparison with July needs care, however. Reuters reported that July’s annual core reading was revised down to 3.0%, matching August. There was no new decline between those two months, and headline inflation remained above the Fed’s 2% target.
Treasury yields also reversed their initial decline. CoinDesk reported that the US 10-year yield recovered to around 5.28% after falling as low as 5.20%. A rebound in yields can weaken the initial support for riskier assets by increasing the return available on government bonds.
That is a possible explanation for the fading momentum, but timing alone does not prove what caused Bitcoin’s reversal. The chart shows more clearly which price levels buyers failed to hold.
Bitcoin cleared resistance briefly, then fell back below it
The Bitstamp four-hour chart shows the September 30 spike reaching roughly $85,500. The candle’s long upper wick records the move higher and the retreat that followed. At 21:20 UTC, Bitcoin was near $83,700, below the 50-period simple moving average around $84,200.
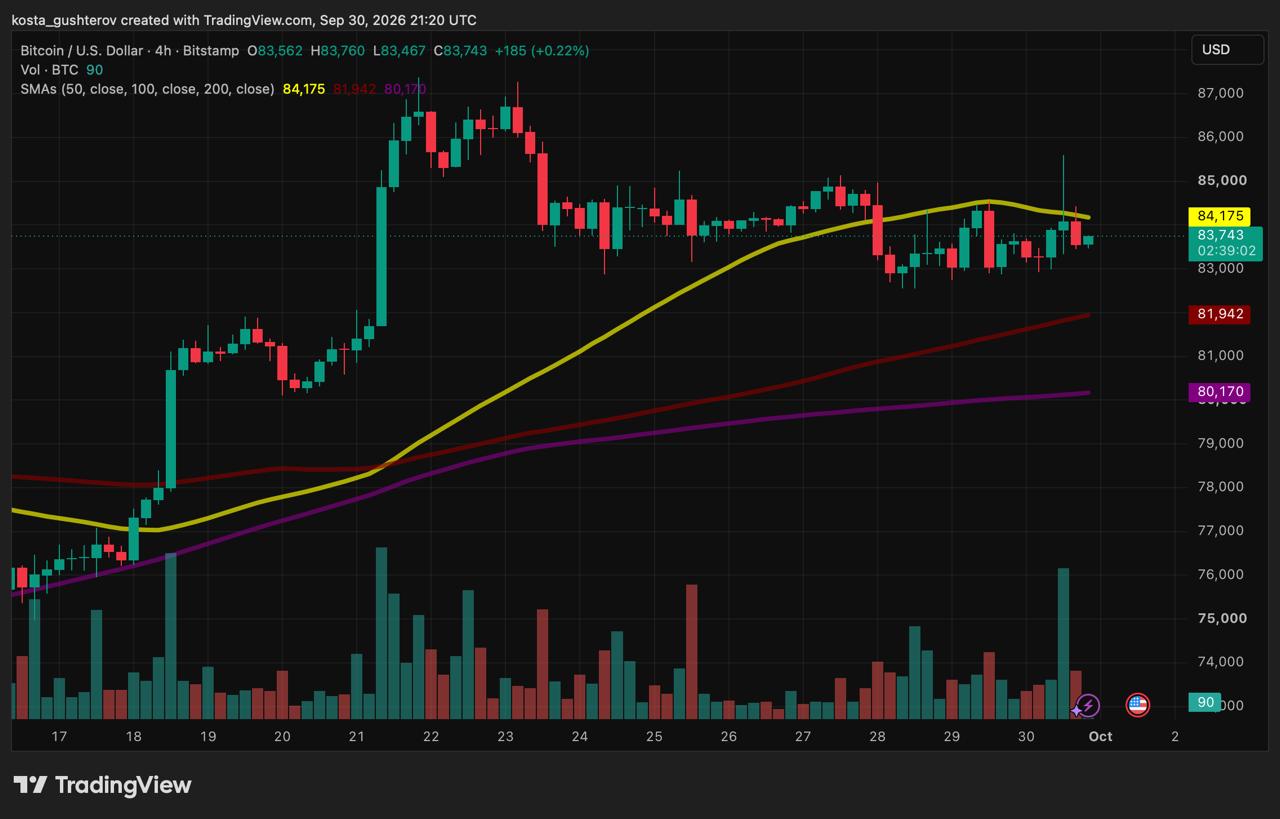
The 50 SMA averages the closing prices of 50 four-hour candles. Bitcoin crossed above it during the rally, but was back underneath it later. That makes the average the first level to reclaim before another attempt at the rejected price area.
Levels are rounded from the September 30 chart snapshot. Moving averages change with each candle.
A four-hour close above the 50 SMA, followed by a pullback that holds around it, would be more convincing than another brief spike. It would show buyers maintaining higher prices after the initial buying subsides.
Bitcoin had already traded above $87,000 earlier in September. The inflation jump was therefore an attempt to recover lost ground within the month’s range, with the earlier high still overhead.
The failed rally does not erase September’s gains
That wider range helps put Santiment’s assessment in context. The analytics firm described Bitcoin as outperforming stocks and gold heading into the fourth quarter. At the time of its post, it estimated BTC had gained roughly 7% in September, while the S&P 500 barely moved and gold fell more than 6%.
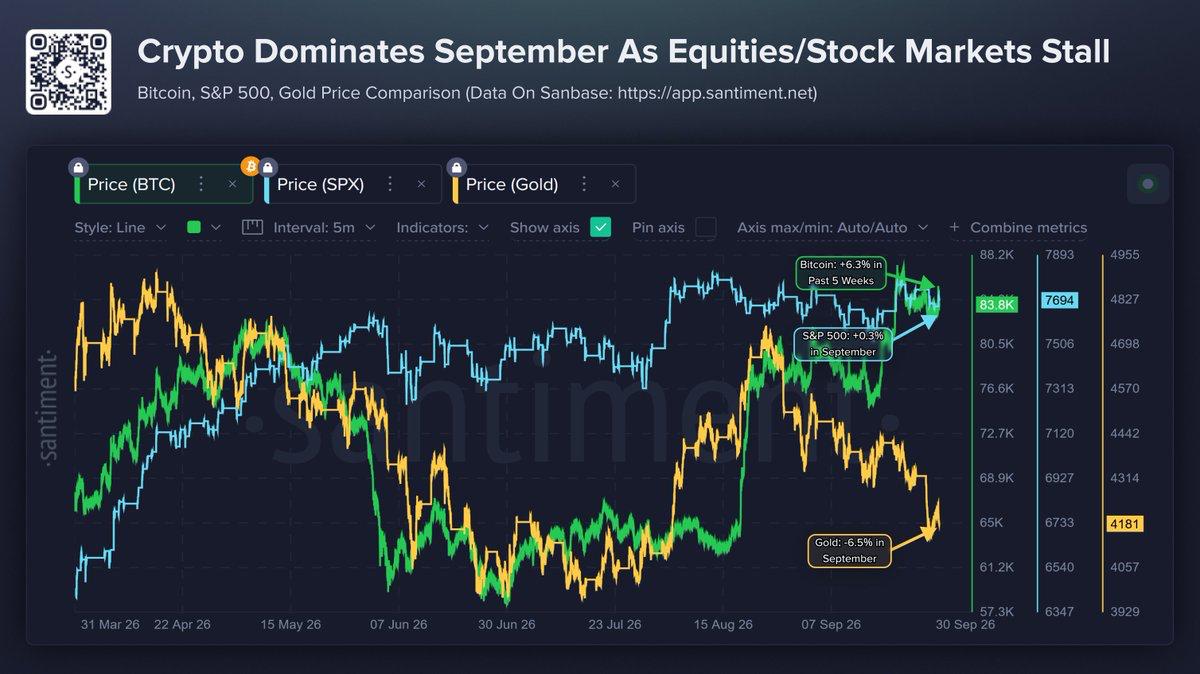
The graphic uses a different Bitcoin comparison from the post: it marks a 6.3% gain over five weeks, alongside September changes of +0.3% for the S&P 500 and -6.5% for gold. These figures should not be treated as returns over the same period.
A failed intraday recovery can coexist with those earlier gains. Santiment is describing the wider advance; the four-hour chart is testing whether buyers can restart it.
Santiment’s demand argument also has a concrete example in Strategy’s purchase of 1,665 BTC. The company’s September 28 disclosure covered purchases made between September 21 and September 27. That confirms corporate buying during the month, while placing it before the inflation release.
The next attempt needs buyers to stay
The next recovery will be more useful if it lasts beyond the initial burst. Two outcomes would change the short-term reading:
- A sustained recovery: Reclaiming the 50 SMA and holding above it would improve the prospect of another attempt at the rejected $85,000 area.
- A deeper pullback: A sustained move below the trading area near $83,000 would increase attention on recent lows and the lower moving averages. Those averages are reference levels, rather than guaranteed support.
A recovery while Treasury yields stay elevated would be a more demanding test of buyers than another rally on favourable inflation news. Holding higher prices in that setting would strengthen Santiment’s demand argument without relying on a fresh improvement in the rate outlook.

Kosta has reported on cryptocurrency markets and blockchain infrastructure since 2020, bringing over six years of hands-on experience in the crypto industry built through daily tracking of markets, trends, and emerging blockchain developments. Specializing in Bitcoin on-chain analysis, institutional ETF flows, and digital asset price action, his work at Coindoo has been cited by other news agencies and consistently covers market developments with a focus on data-driven reporting across Bitcoin, Ethereum, Solana, and XRP.
Over the years, Kosta has contributed to multiple crypto media outlets in different regions, authoring over 6,000 articles across the sector. His reporting spans cryptocurrency markets and the broader fintech industry, tracking not only price action but also the technological and regulatory forces shaping the ecosystem.
To support his analysis, Kosta actively leverages on-chain data and metrics from leading platforms such as Santiment, Glassnode, and CryptoQuant, enabling deeper, evidence-based market insights. He believes in the power of transparency and the data that underpins the blockchain ecosystem.
His academic background in Marketing Management from Denmark further complements his analytical approach, adding a strong understanding of communication strategy and content positioning to his work.



Be the first to comment