



Bitcoin (BTC) price has rebounded nearly 12% from its July low of around $57,800, climbing back to nearly $65,000 as buyers continue defending an ascending channel. The recovery has brought the world’s largest cryptocurrency within striking distance of the key $67,300 resistance, where a decisive breakout could pave the way toward $70,000 and beyond. However, Bitcoin’s on-chain data paints a mixed picture.
While daily transaction activity has surged to multi-year highs, the number of active addresses has continued to decline, suggesting the rally is being driven by increased activity from existing participants rather than broad-based network growth. Can bulls capitalize on strengthening network utilization to reclaim the next major resistance?
Bitcoin Recovering Within a Rising Channel
Bitcoin has maintained its recovery after rebounding from the $57,817 swing low earlier this month, climbing nearly 12%to trade around $65,000. The recovery has unfolded within an ascending channel, reflecting a steady series of higher highs and higher lows as buyers regain momentum following June’s correction.
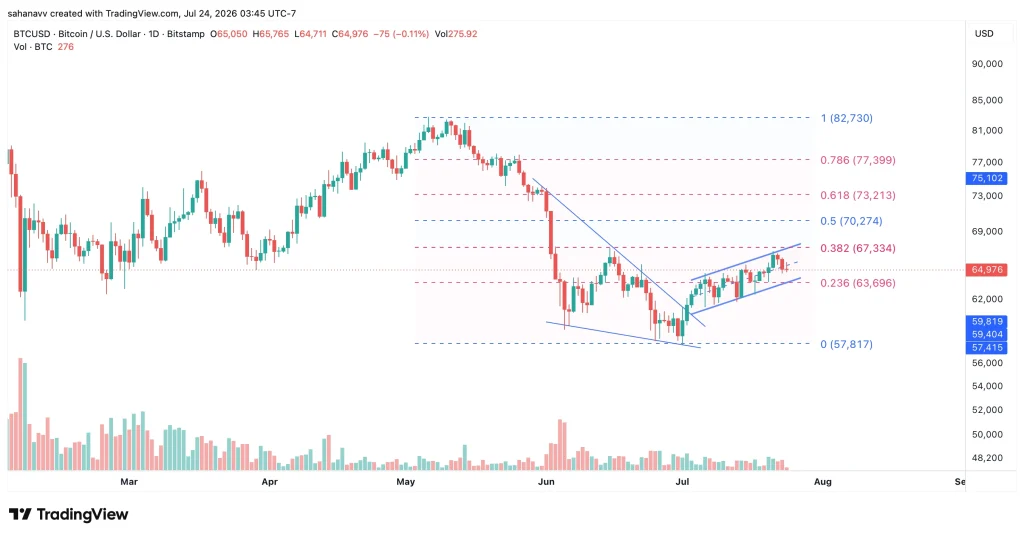
However, the $67,334 region, which aligns with the 0.382 Fibonacci retracement level, now stands as the immediate hurdle for bulls. This resistance has capped the recent advance, making it the most critical level to watch in the short term. A decisive daily close above this zone would confirm a continuation of the recovery and strengthen the case for a move toward the 0.50 Fibonacci retracement at $70,274.


Conversely, another rejection near resistance could extend Bitcoin’s consolidation within the ascending channel. In that scenario, the $63,696 support, which coincides with the 0.236 Fibonacci retracement, is expected to act as the first demand zone. A breakdown below this level would expose the channel’s lower boundary and shift attention toward the $59,819–$57,817 support region.
On-Chain Activity Signals Growing Network Utilization Despite Declining Active Addresses
Bitcoin’s on-chain metrics present a contrasting picture as the cryptocurrency approaches a critical resistance level. While the number of active addresses has continued to trend lower over the past year, daily transaction activity has surged to its highest levels in recent years, suggesting network utilization remains robust despite slower user growth.
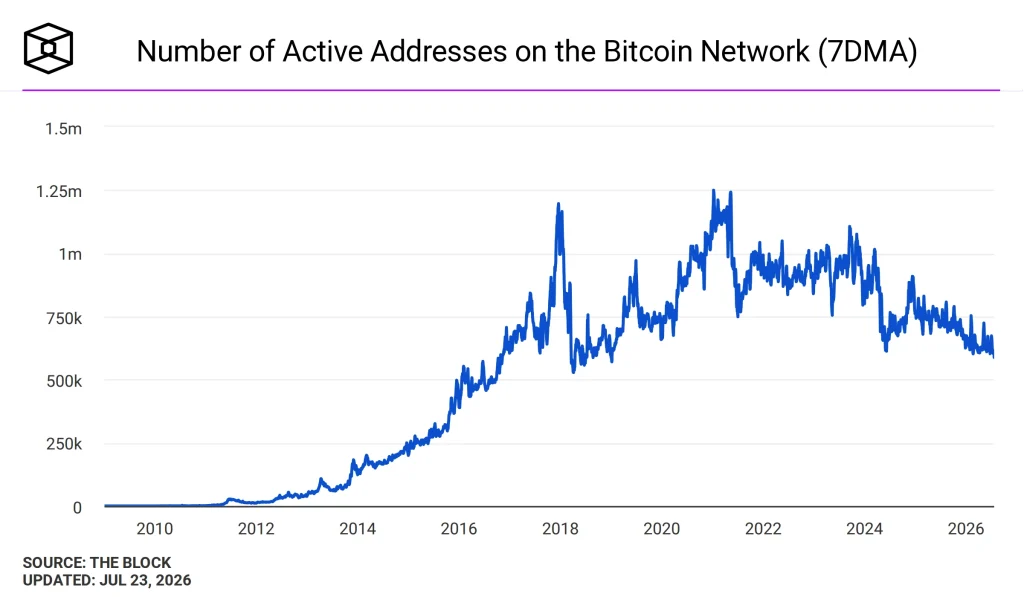
The 7-day moving average of active Bitcoin addresses has declined from around one million in early 2024 to nearly 600,000 in July 2026. This indicates that fewer unique wallets are actively participating on the network, suggesting softer retail engagement than in previous market cycles.
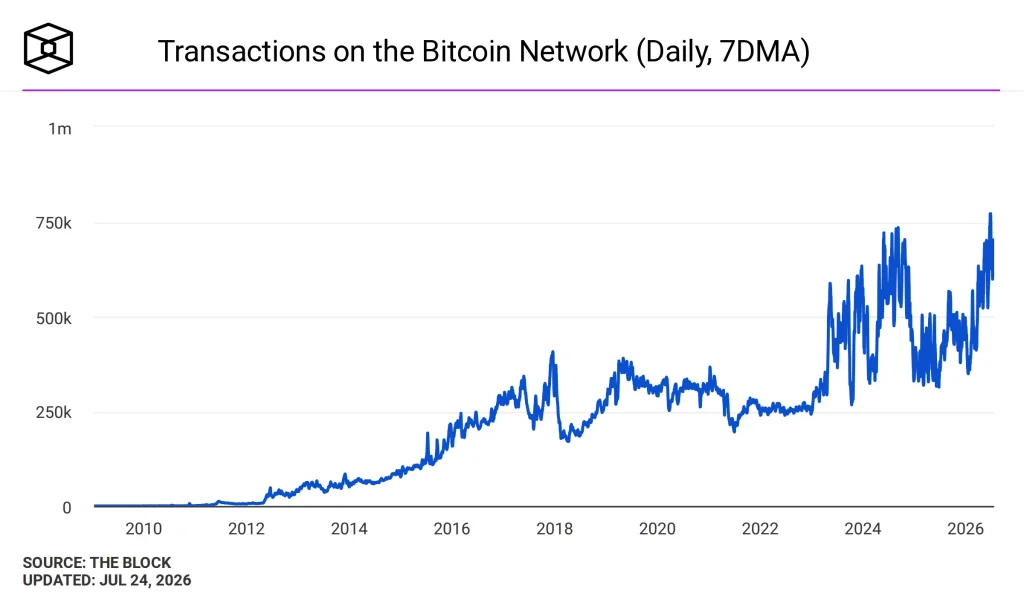
However, the trend in daily Bitcoin transactions tells a different story. Transaction counts have climbed steadily to nearly 750,000 per day (7DMA), reflecting sustained demand for block space and increased economic activity across the Bitcoin network.
The divergence suggests that existing market participants are becoming more active rather than new users entering the ecosystem. Institutional investors, exchanges, long-term holders, and other large entities may be driving the higher transaction volume, even as overall wallet participation declines.
What’s Next for Bitcoin Price?
Bitcoin price remains in a constructive technical position, trading within an ascending channel as it approaches the key $67,334 resistance. A decisive breakout above this Fibonacci level could strengthen bullish momentum and open the door toward $70,274 and $73,213 in the near term.
At the same time, Bitcoin’s on-chain data presents a nuanced outlook. The steady rise in daily transaction activity points to healthy network utilization, while the decline in active addresses suggests the recovery is being driven by existing participants rather than a broad influx of new users. As a result, $67,334 remains the defining level for BTC.
Was this writing helpful?
Story Ends Here
Trust with CoinPedia:
CoinPedia has been delivering accurate and timely cryptocurrency and blockchain updates since 2017. All content is created by our expert panel of analysts and journalists, following strict Editorial Guidelines based on E-E-A-T (Experience, Expertise, Authoritativeness, Trustworthiness). Every article is fact-checked against reputable sources to ensure accuracy, transparency, and reliability. Our review policy guarantees unbiased evaluations when recommending exchanges, platforms, or tools. We strive to provide timely updates about everything crypto & blockchain, right from startups to industry majors.
Investment Disclaimer:
All opinions and insights shared represent the author’s own views on current market conditions. Please do your own research before making investment decisions. Neither the writer nor the publication assumes responsibility for your financial choices.
Sponsored and Advertisements:
Sponsored content and affiliate links may appear on our site. Advertisements are marked clearly, and our editorial content remains entirely independent from our ad partners.
Read the Next News






Be the first to comment