


What to know:
- Hyperliquid (HYPE) enters consolidation after a breakout near $45, signaling market indecision after bullish momentum.
- Analysts highlight a possible rally, with projections suggesting up to +215% upside if key resistance levels are broken.
- Technical indicators show neutral momentum as the RSI is at 51, while the price tests the 20-day EMA as a support.

Hyperliquid (HYPE) is moving in a consolidation phase after a strong breakout that had pushed the price near $45. According to CoinMarketCap, the HYPE price has remained stable over the last 24 hours but declined by 7.28% over the last week.
At the time of writing, the token is trading at $40.95 with a trading volume of $151.36 million, which has declined by 28.19% over the last 24 hours. However, its market capitalization stands at $10.45 billion, which is stable.
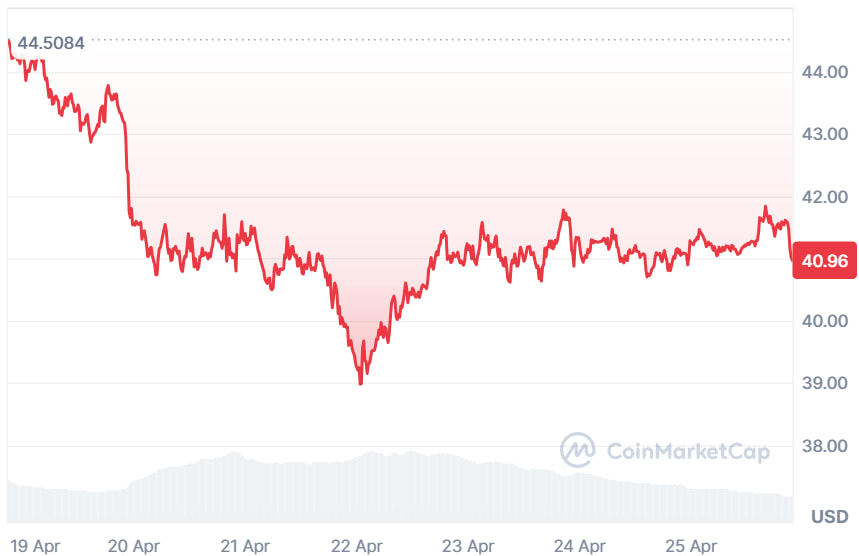

Source: CoinMarketCap

Also Read: HYPE Exchange Supply Drops 22.86% as Whale Buys Rise
HYPE Price Breakout Signals Massive +200% Rally
Furthermore, the crypto analyst Javon Marks revealed that HYPE has become one of the market’s strongest performers, surging sharply after breaking a long-standing resistance level.
The breakout signals a potential shift in trend momentum, as buyers regain control and push price action higher. Traders are now watching closely as this move suggests renewed bullish strength and increasing market interest.

Source: Javon Marks’ X Post
In the event of a breakout, technical experts are looking to push through at the $0.5497 level, which is likely to offer another potential profit gain of 215%.
Even as bullish momentum remains strong, there is still potential for a temporary retracement in order to allow traders to book their gains.
Technical Indicators Point to Consolidation Phase
According to TradingView, a consolidation period is depicted by HYPE after an upward momentum move that was strong but is now transitioning to a consolidative phase following a peak above $45.
The current value of the coin is at $40.88, hovering around the 20-day EMA line. The idea is to see if a good base is established at this point.

Source: TradingView
The momentum is also supportive of this neutrality, as indicated by the RSI indicator reading of 51.66. This shows a market that is in equilibrium without extremes.
Convergence between price action and short-term indicators denotes that the market is indecisive about direction. Traders are currently in a waiting game for a decisive trigger.
This article contains market analysis and price predictions. These are not guarantees. Crypto markets are volatile. Always DYOR. Not financial advice.
Also Read: HYPE Trades Turn Into $559K Gains for Smart Trader in 4 Months

Be the first to comment