


What to know:
- The RENDER price faces rejection at $1.81 resistance, with bearish RSI divergence signaling weaker bullish momentum.
- Technical structure shows mixed signals, as short-term consolidation continues within a broader bearish trend.
- If bulls fail to reclaim $1.81, RENDER could drop toward $1.40 support, a key level watched for stabilization.

RENDER price is under selling pressure after repeated rejections at key resistance, with weakening momentum and bearish divergence signaling fading bullish strength. If buyers fail to regain control, downside risk increases toward lower support. Indicators show mixed signals, with short-term consolidation within a broader bearish trend.
At the time of writing, RENDER is trading at $1.73 with a 24-hour trading volume of $47.02 million and a market capitalization of $898.27 million. Following the 4.81% gain over the last 24 hours, the RENDER price structure and improving technicals point to a bullish reversal ahead.
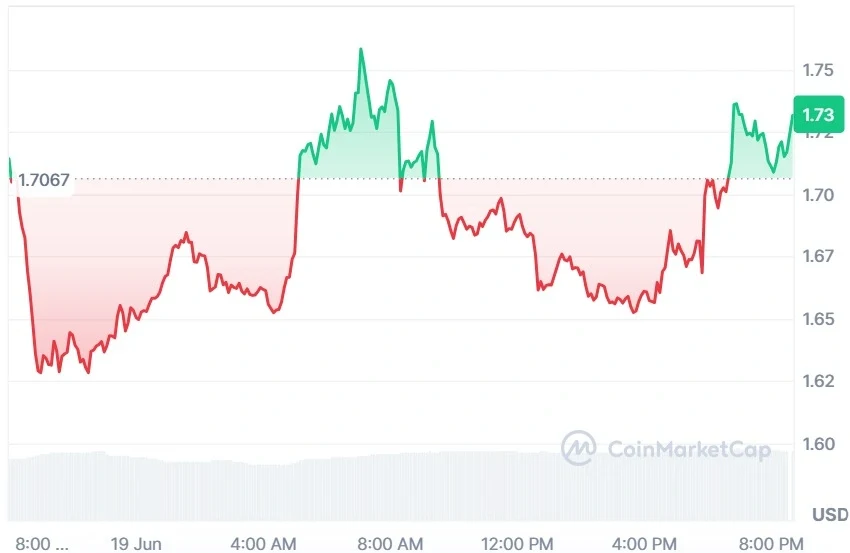

Source: CoinMarketCap

Also Read: RENDER Price Analysis: Long-Term Bullish Structure Points to $22 Breakout
RENDER Price Rejection Could Trigger Downtrend
The data from Token Talk revealed that RENDER is facing renewed selling pressure after repeated rejections near the $1.81 resistance zone. A bearish RSI divergence has emerged, indicating weakening momentum despite RENDER attempts to hold higher levels.
This technical setup often signals fading bullish strength, suggesting that buyers are losing control as overhead resistance continues to cap upward movement.


Source: Token Talk’s X Post
However, if bulls fail to gain ground and remain above $1.81, there could be an increase in downside risks, and the RENDER price might find its way into the $1.40 support area.
The traders have their eyes on this level in the hope of either a correction or some stability in prices. The momentum indicators agree with the shift to a bearish trend structure.
Technical Indicators Point to Improving Sentiment
According to TradingView, RENDER has been moving toward gains following a strong decline in mid-June that saw the RENDER price fall from $2.40 to around $1.50.
At present, the upper boundary is represented by the resistance level just above the 20-day moving average at $1.77, while the RENDER price is trading below the middle Bollinger Band at the range of $2.13-$1.41.

Source: TradingView
The MACD histogram reduces the hue of its red color and shows a bright green one, suggesting that selling pressure is diminishing because of the buyers’ pressure coming from lower prices.
The blue-colored MACD line tries to touch the orange-colored signal line by increasing its value. Being below the level of zero, both lines indicate the RENDER price consolidation within a bearish trend.
This article contains market analysis and price predictions. These are not guarantees. Crypto markets are volatile. Always DYOR. Not financial advice.
Also Read: RENDER Price ConsolidatIon Signals a Bullish Breakout Toward $14+ Rally

Be the first to comment