



What to know:
- The Ethereum price needs a daily close above $1,796 to confirm the bullish setup ahead.
- CoinGlass data shows ETH volume rising sharply as open interest slips to $24.40 billion.
- ETH stays below the 50-day EMA while RSI improves without showing overheated momentum.

Ethereum price stayed in focus on Tuesday, July 7, 2026, as traders watched whether ETH could reclaim a key breakout zone. Analyst said confirmation depends on a close above resistance, followed by a successful hold as support.
At the time of reporting, Ethereum (ETH) is trading at $1,766, showing a decline of 0.13% in a day. The trading volume is showing a strong bullish surge up 56.03% and is currently standing at $17.32 billion. Over the last week, the coin price has increased by $17.32 billion, according to CoinMarketCap.
Also Read: BNB Price Breakout Targets $630 as Binance Expands Into the Philippines

What Happened Ethereum Price Tests Key Resistance
Crypto Analyst Martinez highlighted that Ethereum is testing the 0.8 MVRV Pricing Band at $1,796. He cited this level as resistance and the bullish trigger zone at $1,800.
If it breaks and closes above $1,796 per day, the bullish case may be improved. If that price is held, the movement toward Ethereum’s Realized Price at $2,245 could be possible.
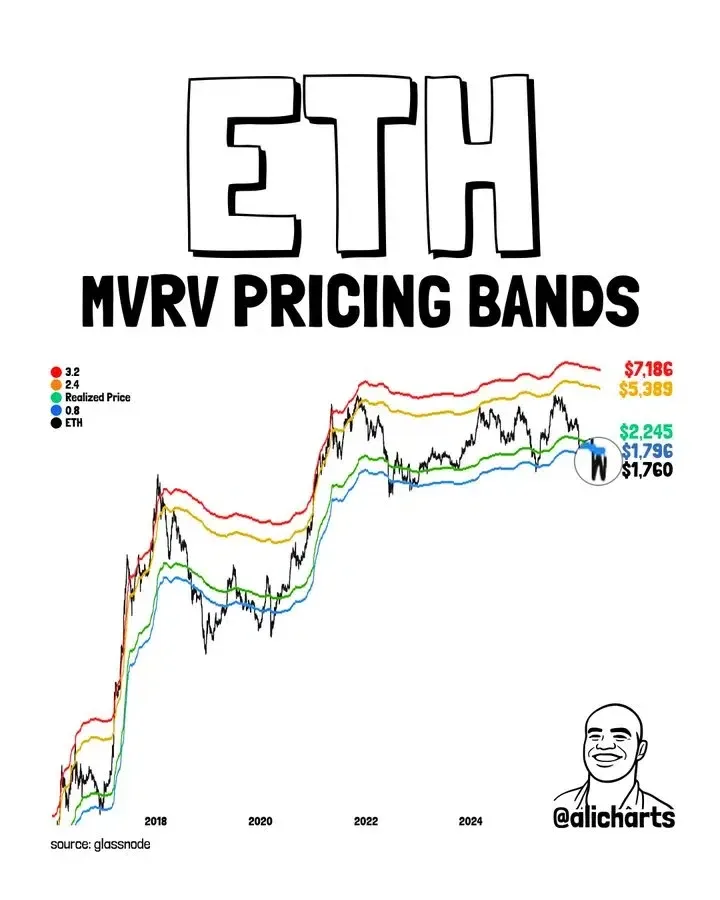
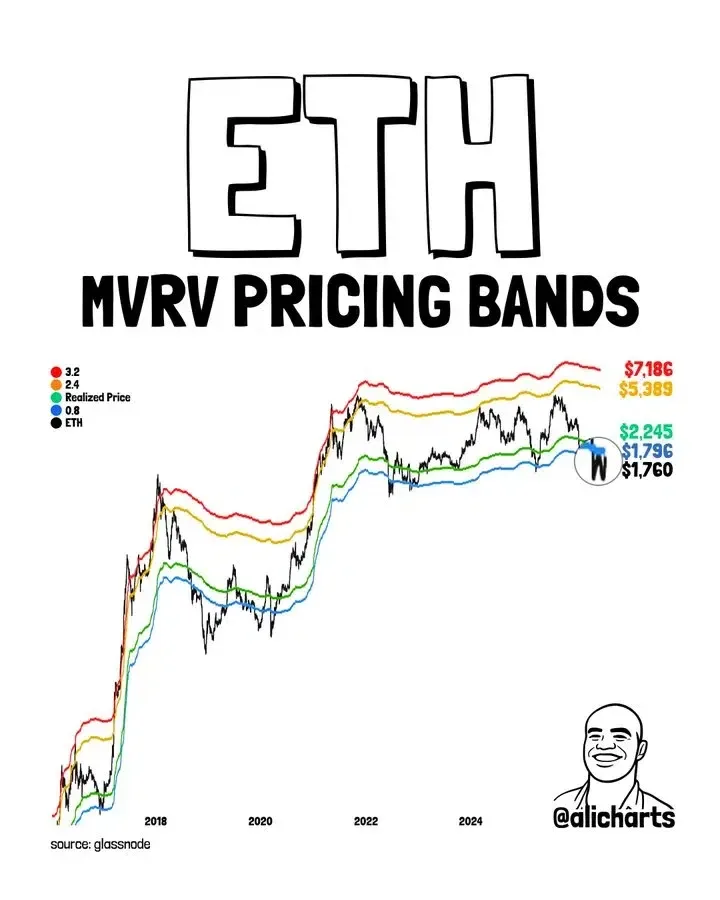
Why $1,800 Matters For Traders
The level is important due to technical confluence. Martinez said the TD Sequential resistance trendline also sits near $1,796.
The TD Sequential risk line stands higher at $1,816. If the price moves above $1,796 and $1,816, it could be a bull run.
Ethereum price may then head in the direction of channel resistance at $1,844. If buyers clear that zone, the larger target remains the $2,245 Realized Price.
Where Derivatives Data Stands
CoinGlass data shows stronger derivatives activity. The future volume rose 72.57% to $45.93 billion. Open interest fell 0.89% to $24.40 billion. The ETH OI-weighted funding rate stood at 0.0065%.
Data from the liquidation heatmap shows that the Ethereum price is trading close to an important liquidity zone at $1,760. This region was significant as ETH had lost momentum after rallying above $1,800. The break below this area may ruin the short-term setup.
Upside liquidity remained visible near $1,800, $1,830, and $1,850. These levels are in line with the overall breakout range provided by the technical setup. ETH requires a daily close above $1,796 with a daily hold above $1,816 for bullish continuation.
EMA And RSI Data Shape The Outlook
From a technical perspective, the EMA data reveals the Ethereum price oscillating between two short-term moving averages. ETH remained below the 50-day EMA at $1,804.1, which acts as near-term resistance. But it remained above the 20 EMA at $1,709.60 and indicated that short-term support has not completely broken.
The long-term EMA structure continues to exhibit more resistance over the prevailing price level. The 100-day EMA stood at $1,967.6, while the 200-day EMA was at $2,251.0. These levels indicate Ethereum’s need to overcome a few hurdles before a larger recovery can build momentum.
The Relative Strength Index (RSI) data shows a strengthening momentum without pointing to an overbought market. The RSI sits at 55.18, while the moving average is at 43.19. This indicates that buyers have become stronger, but ETH requires a more solid break above the resistance to indicate bullish continuation.
Also Read: Litecoin Price Prediction Turns Bullish: Can LTC Hit $50 Next?



Be the first to comment