



Cardano gains 6% as Ethereum and XRP recover cautiously. October 10 analysis maps support, resistance, and key signals for ETH, XRP, HYPE, ADA, and Uniswap.
| Asset | Aggregate USD price | Rolling 24-hour change | Aggregate 24-hour volume | Market-cap rank |
|---|---|---|---|---|
| Ethereum (ETH) | $2,490.34 | −0.08% | $8.51 billion | 2 |
| XRP | $1.40 | +0.55% | $1.65 billion | 5 |
| Hyperliquid (HYPE) | $83.86 | −1.83% | $627.49 million | 11 |
| Cardano (ADA) | $0.250879 | +6.38% | $533.38 million | 17 |
| Uniswap (UNI) | $7.35 | −0.21% | $472.85 million | 27 |
Ethereum Remains Below Its 50-Day EMA
Ethereum closed October 9 at $2,485.34 on Kraken, gaining 0.50% from $2,472.90. The session’s $2,469.04–$2,518.11 range stayed inside the previous day’s wider range, showing stabilization after the decline without a confirmed reversal.
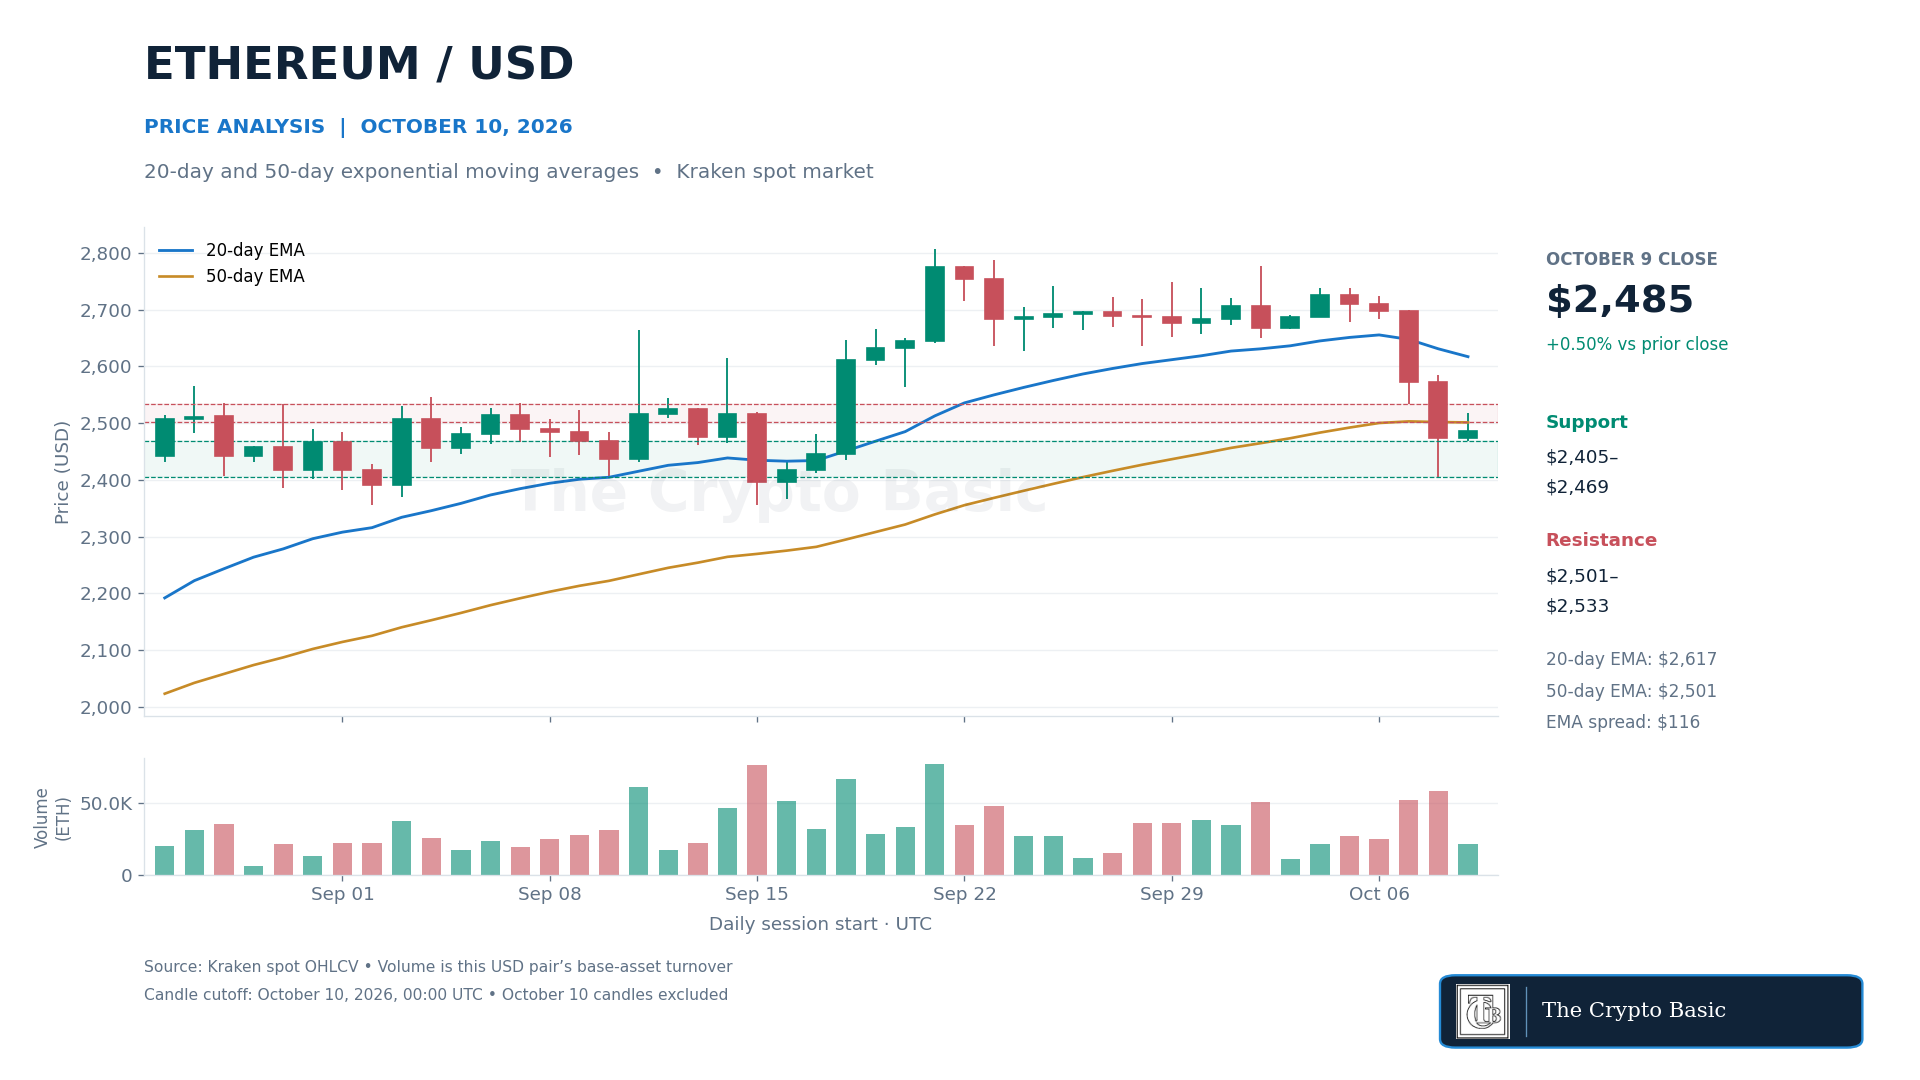
The 50-day exponential moving average eased to $2,501.13, while the 20-day EMA fell to $2,616.99. Although the shorter average remains above the longer one, price closed below both. That combination shows the recent selloff has outpaced the slower adjustment in the averages.
ETH traded above the 50-day EMA during the session but failed to retain that level at the close. A daily close above $2,501, followed by a break above $2,518–$2,533, would strengthen recovery prospects toward $2,585.31. The declining 20-day EMA near $2,617 is a further obstacle.

Initial support is $2,469.04. A close below it would expose the October 8 low at $2,405.35; losing that low would reopen the September lows around $2,355–$2,367. A recovery above $2,533 that subsequently closes below $2,501 would weaken the bullish case.
ETH’s aggregate quote was approximately 2.86% below the $2,563.70 snapshot in its October 8 report. The $2,533 support discussed then has since failed on a completed daily close.
XRP RSI Improves but Stays Below Neutral
XRP closed October 9 at $1.39438, up 1.10% from $1.37915. Its $1.37297–$1.40583 session range was entirely inside the preceding candle, leaving the October 8 low intact.
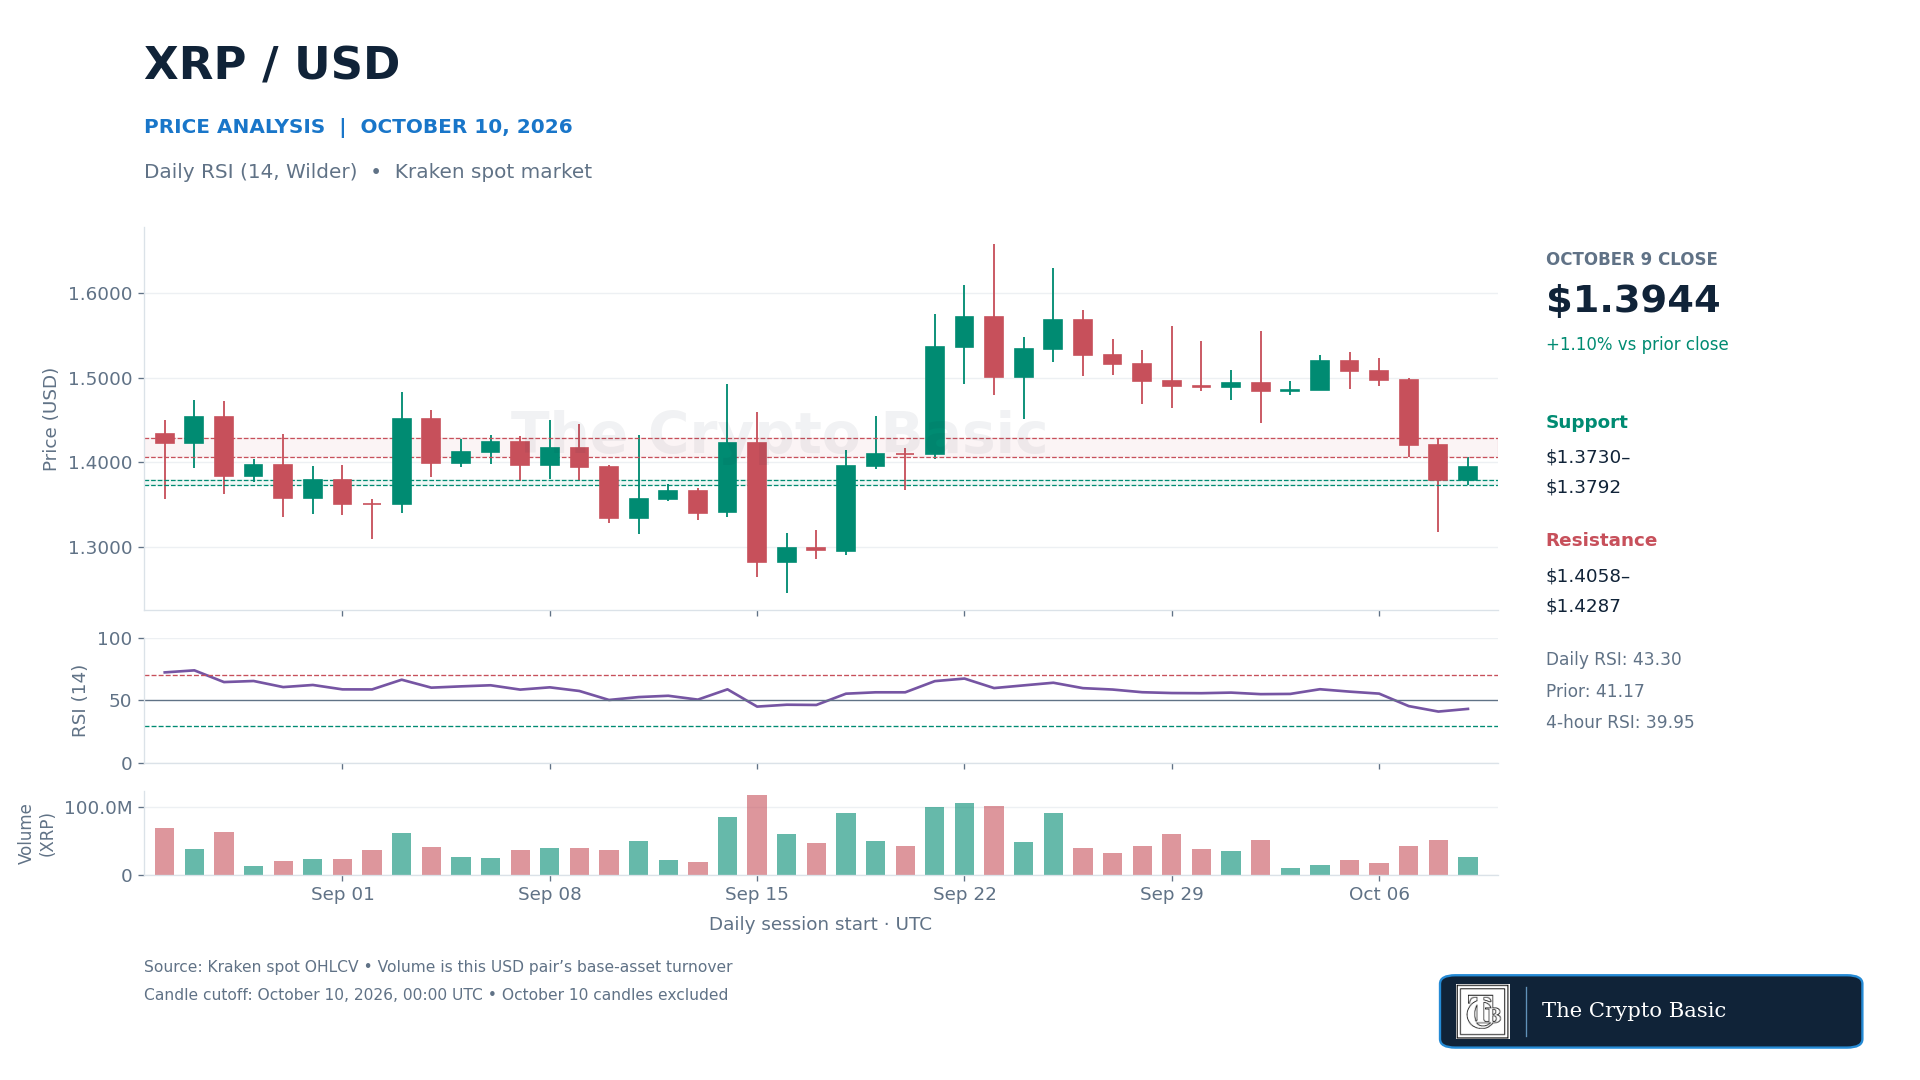
Daily RSI, calculated over 14 periods with Wilder smoothing, rose to 43.30 from 41.17. Momentum improved with the higher close but remained below the neutral 50 line.
Four-hour RSI at the synchronized cutoff was 39.95, also below neutral. Neither reading establishes a completed momentum reversal.
The first support area spans $1.37297–$1.37915, combining the latest low with the preceding close. A daily close below $1.37297 would weaken the rebound and place $1.31770 back in focus.
A close beneath that lower boundary would invalidate the developing base and expose the September lows at $1.24610–$1.26409.
For recovery, XRP needs a daily close above $1.40583, followed by $1.42869. Clearing both would reopen the former support area around $1.447–$1.464. A return below $1.40583 after that breakout would weaken its confirmation.
The aggregate quote increased from Friday’s rounded $1.39 snapshot to $1.40, approximately 0.7%.
However, the completed close remained below the initial $1.39796 recovery hurdle identified in the previous report.
Hyperliquid Closes Flat as MACD Weakens
Hyperliquid finished October 9 at $84.16, unchanged from the previous daily close. The session reached $86.56 but settled near the lower part of its $83.33–$86.56 range.
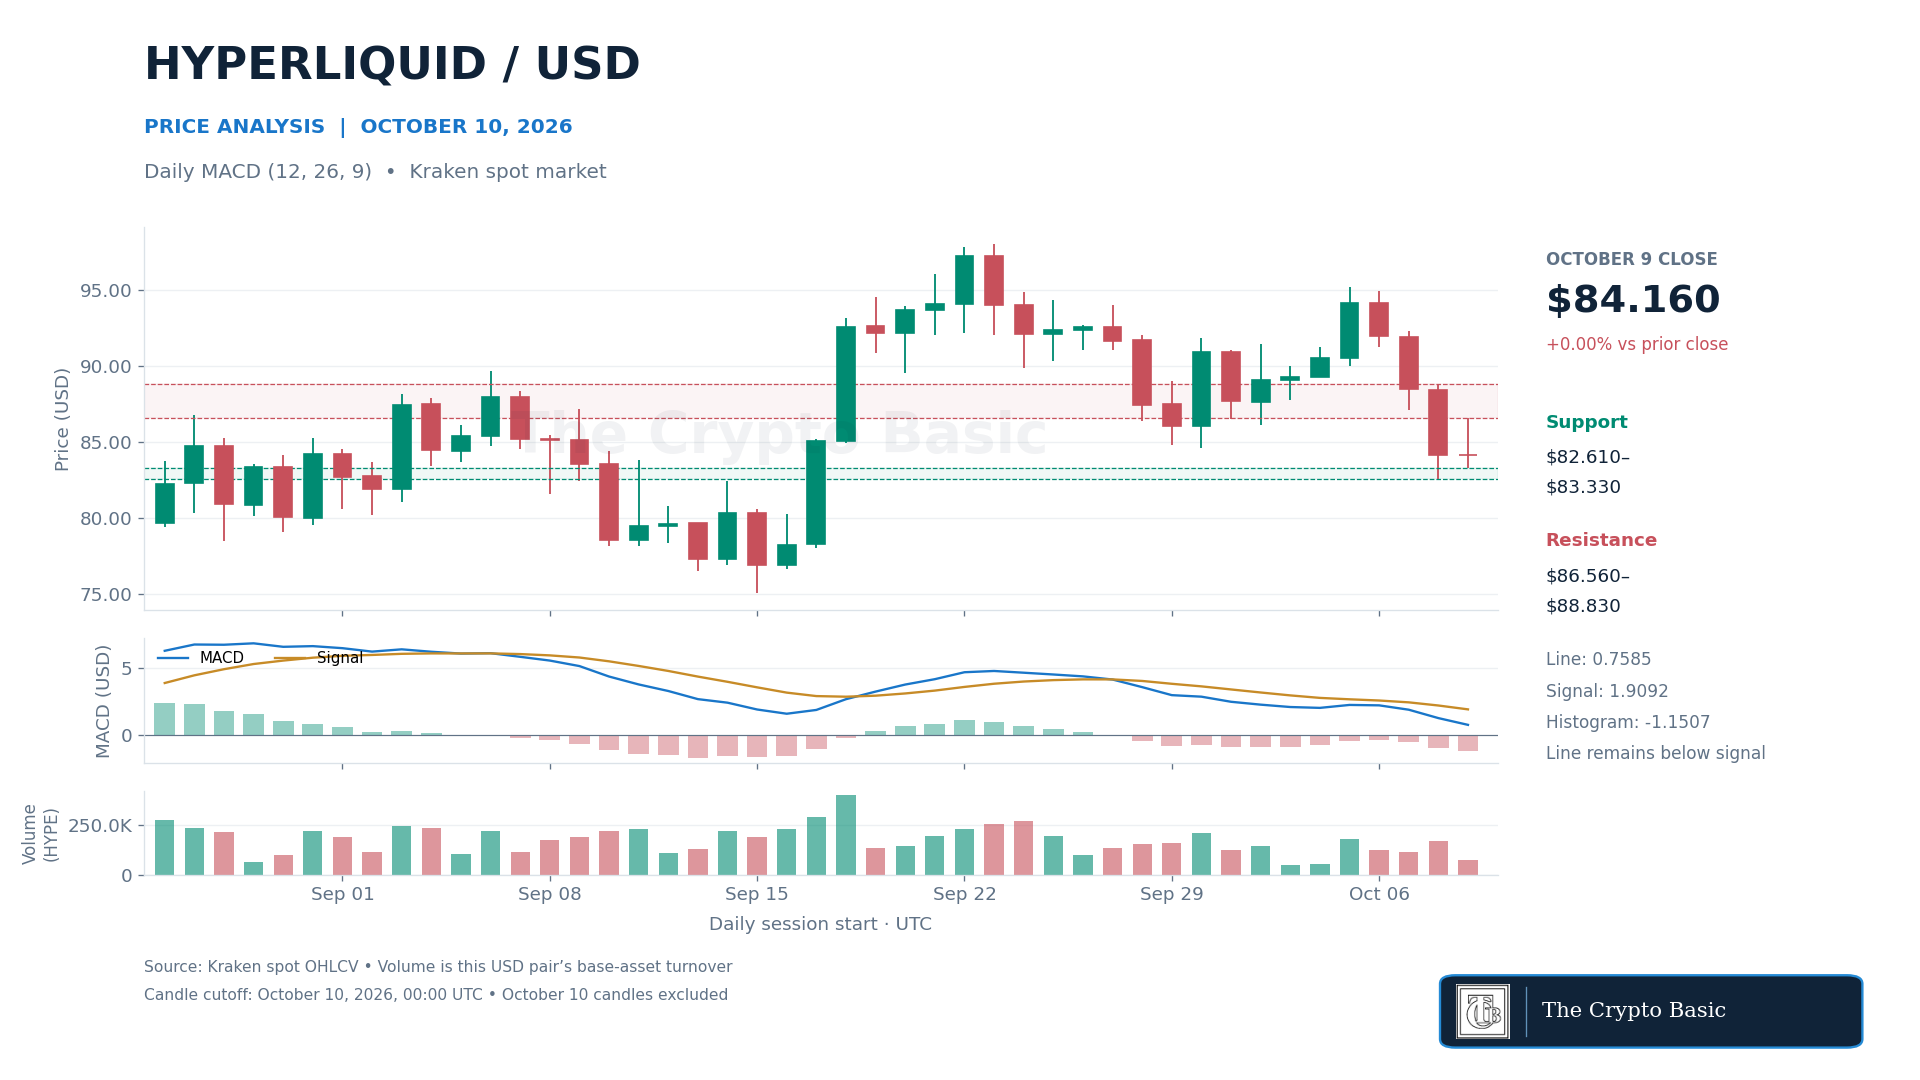
Daily MACD, using 12- and 26-period exponential averages and a nine-period signal EMA, remained below its signal line. The MACD line declined to 0.7585 against a signal of 1.9092. Its histogram became more negative, moving from −0.9359 to −1.1507.
This was continued weakening within an existing bearish line-signal relationship, not a new crossover. The MACD line remained above zero, while the four-hour MACD was below both zero and its signal at the chart cutoff.
Support lies at $82.61–$83.33, the latest two daily lows. A close below $82.61 would confirm another leg lower and expose the September trading area around $80.27–$81.56. The September 15 low at $75.11 is the deeper reference.
A daily close above $86.56 would improve the immediate structure, but $88.83 remains the stronger recovery threshold. Clearing it would reopen $91.28–$92.32. A subsequent close below $86.56 would weaken the breakout scenario.
Cardano Rebounds Toward the 50% Retracement
Cardano closed October 9 at $0.242953, up 4.67%, after reaching $0.243405. The rebound followed the sharp October 8 decline, but the completed close recovered only part of that lost ground.
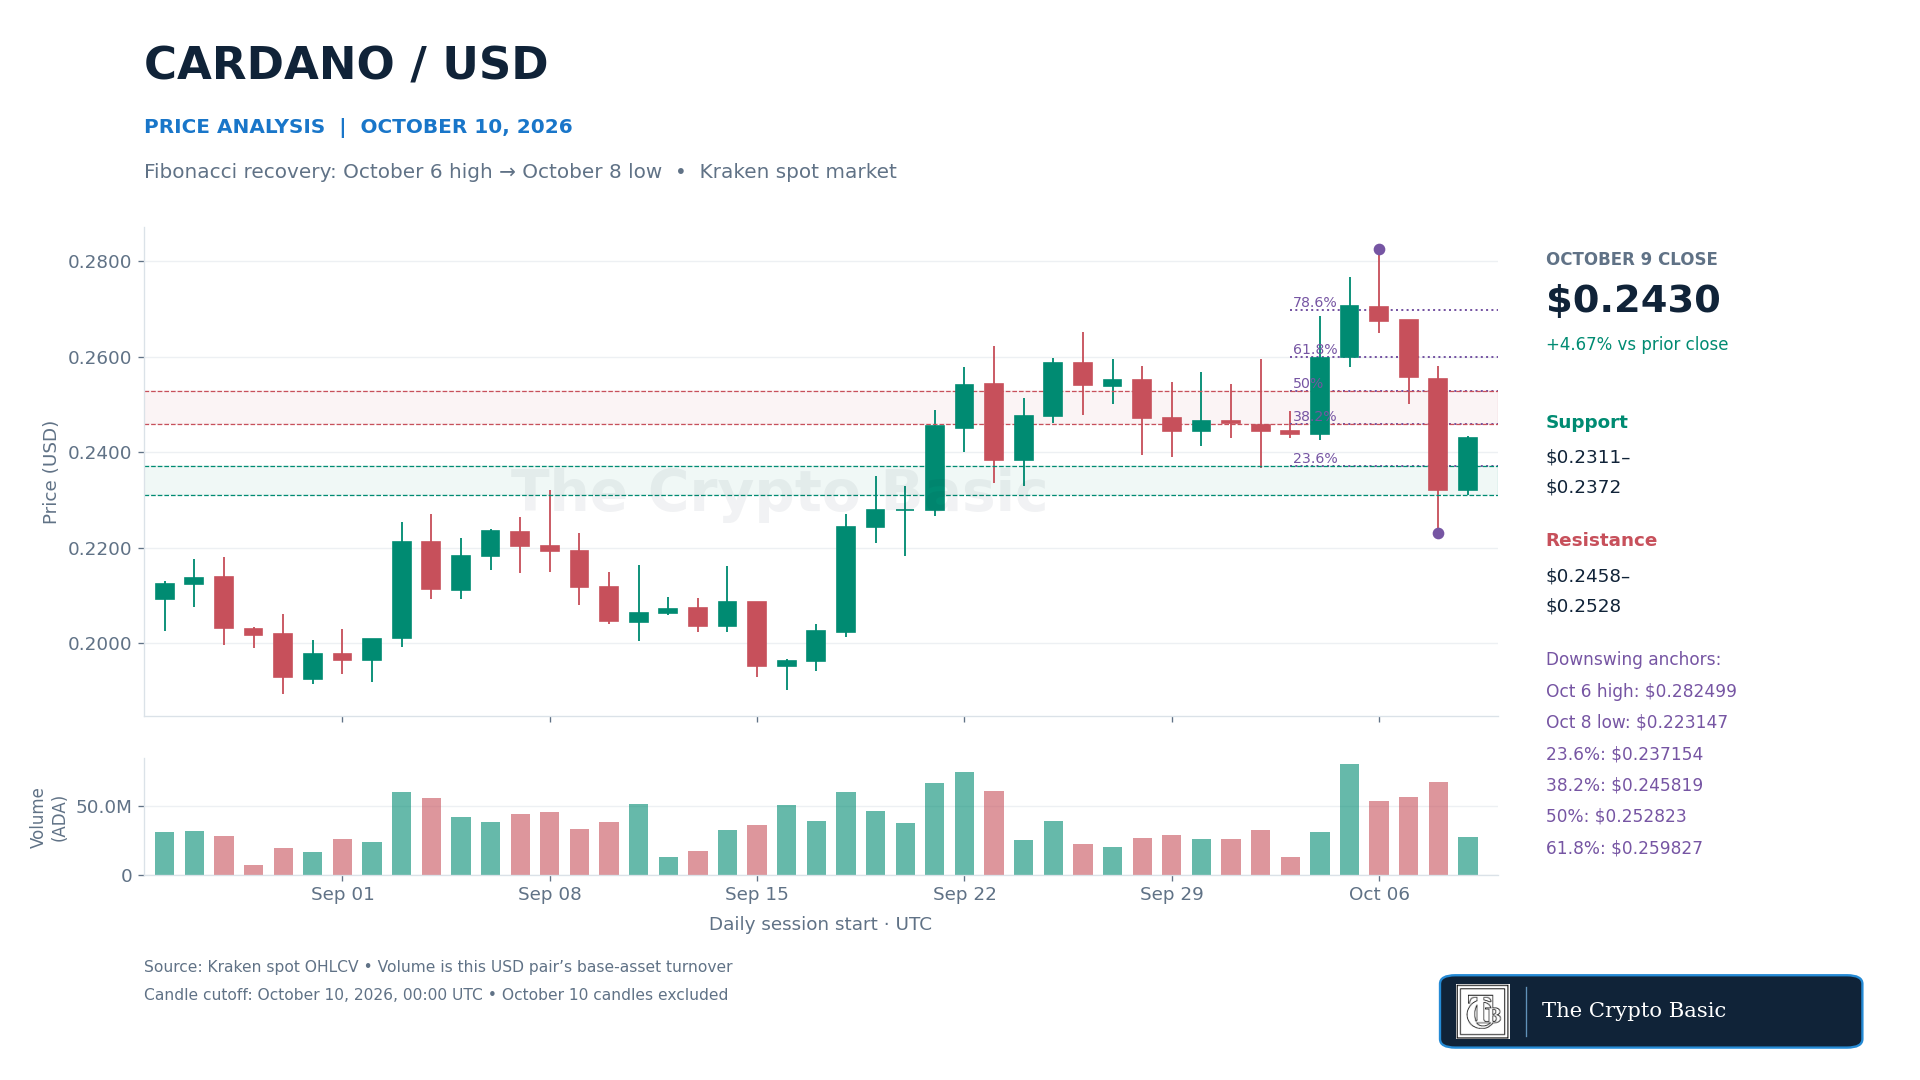
The Fibonacci grid measures an upward retracement of the downswing from the October 6 high of $0.282499 to the October 8 low of $0.223147.
Its principal recovery levels are $0.237154 at 23.6%, $0.245819 at 38.2%, $0.252823 at 50% and $0.259827 at 61.8%.
Friday’s close reclaimed 23.6% but remained below 38.2%. The later aggregate quote of $0.250879 stood above 38.2% and below the midpoint; that advance remains intraday.
A daily close above $0.245819 would confirm the next recovery step. Clearing $0.252823 would strengthen the case for a test of $0.258051–$0.259827, where the October 8 high meets the next retracement.
A close below $0.237154 would surrender the first recovery level and expose Friday’s $0.231118 low. Losing $0.223147 would invalidate the current rebound from the swing low and reopen $0.218200.
These levels describe conditional retracement scenarios, not assured targets.
Uniswap Rebounds but Remains Below Its Lower Bollinger Band
Uniswap closed October 9 at $7.3206, up 2.93% from $7.1120. The session recovered from $7.1039 to $7.4482 but ended below the upper part of that range.
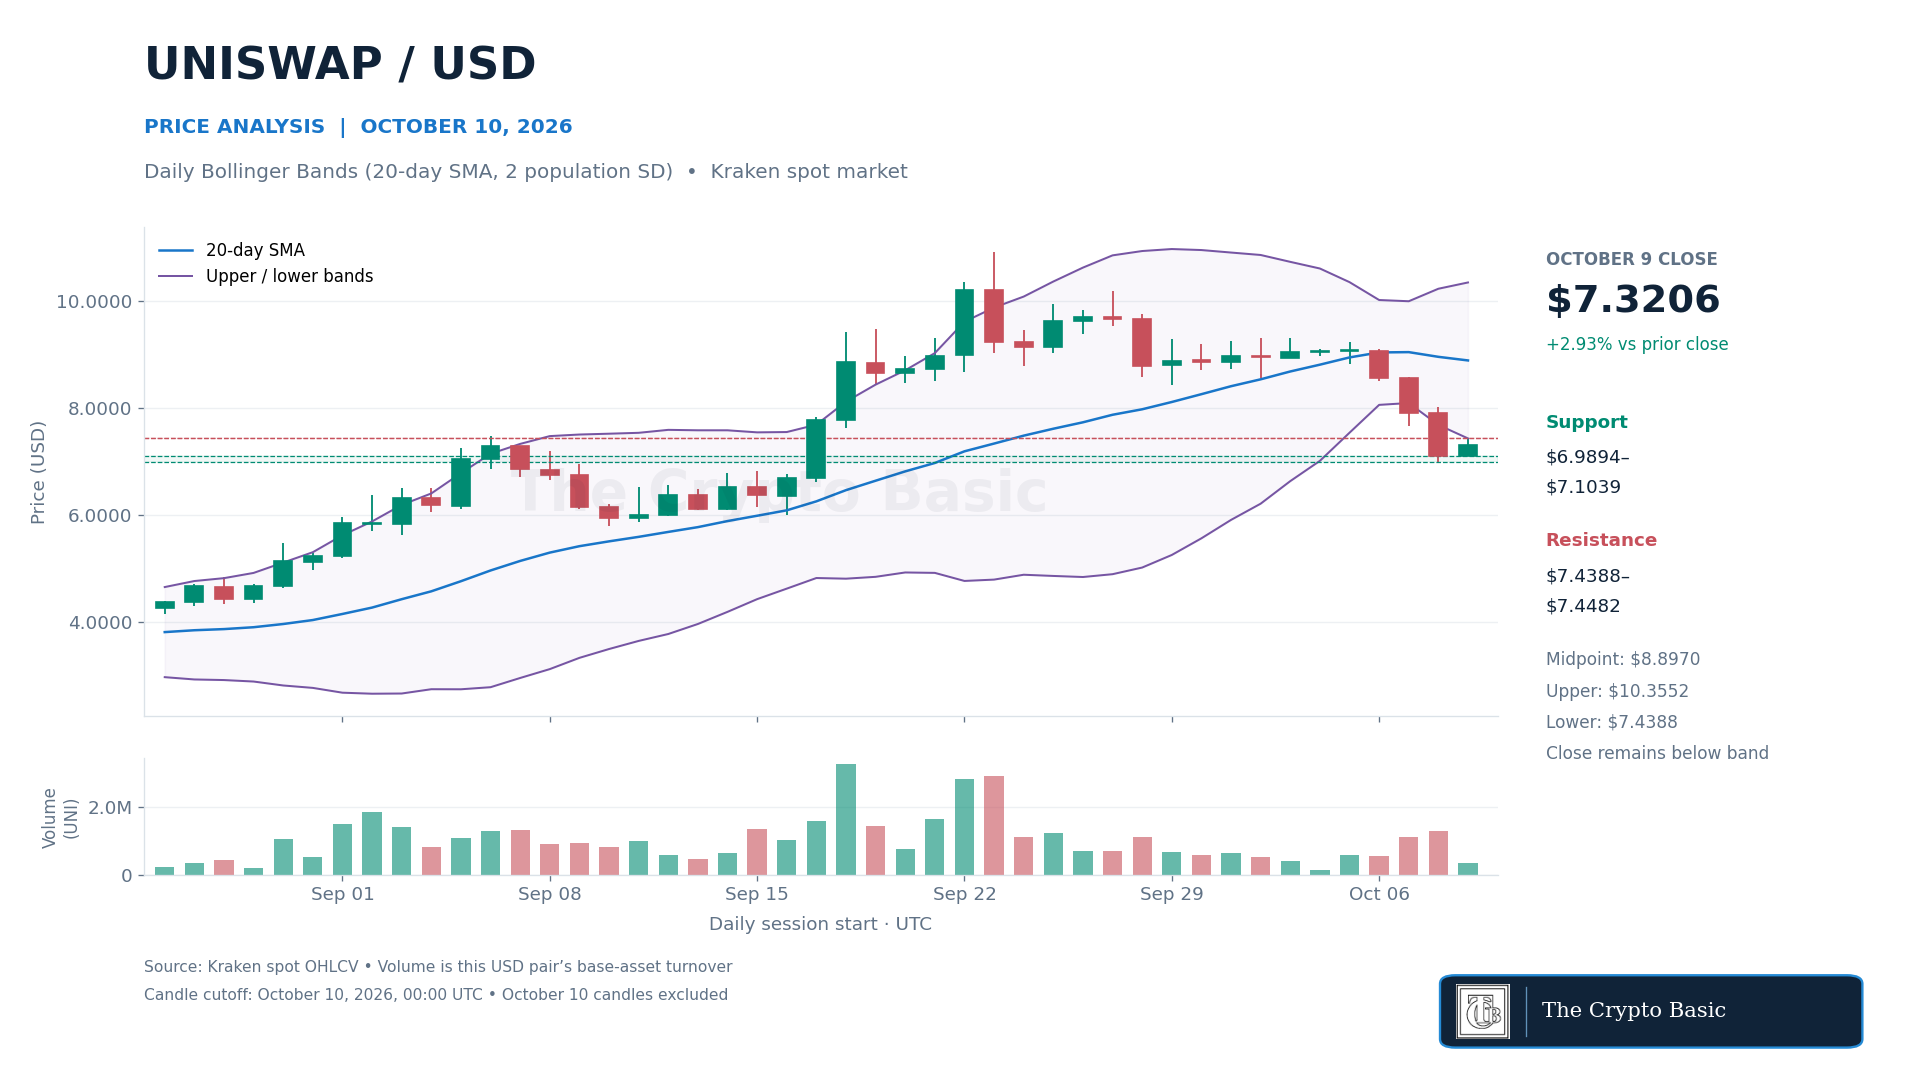
Daily Bollinger Bands, using a 20-day simple moving average and two population standard deviations, placed the midpoint at $8.8970, the upper band at $10.3552 and the lower band at $7.4388. The close remained below the lower band for a second session.
That positioning shows persistent downside pressure relative to the recent price distribution. It does not, on its own, establish that a rebound must follow. Friday’s 348,333 UNI turnover was only 33% of the preceding 20-session average on Kraken.
A daily close above $7.4482 would clear Friday’s high and, if maintained relative to the recalculated band, mark a return inside the envelope. The next resistance references are $7.6730 and $8.0208. A return below $7.4388 would weaken the initial recovery, subject to the band’s daily adjustment.
Support spans $6.9894–$7.1039. Losing $6.9894 on a daily close would invalidate the latest rebound and expose the September support area around $6.6164–$6.6650.



Be the first to comment