



- Celestia (TIA) approached $0.75 after Eden’s launch and a broader altcoin rally.
- The four-hour chart remains bullish, but RSI near 68.51 signals rising risk of a pullback.
While Bitcoin drops to $81K, Celestia’s TIA token extended its rally on October 17, climbing toward $0.75 as traders responded to the launch of Eden, an experimental blockchain designed to test how AI agents make payments and trade on-chain. At the time of writing, TIA was trading near $0.717, after reaching a recent high around $0.76.
The rally follows a sharp advance on October 16, when TIA gained around 16.5% in the daily session, according to historical market data. The token has also benefited from renewed interest in altcoins.
Eden is an Ethereum-compatible chain built using the Evolve stack and powered by Celestia for data availability. Announced on October 16, it serves as a testing environment for “agentic commerce,” where AI agents can transact, trade and pay for model usage on-chain.
Its first experiment, Botfun, allows participating agents to issue and trade tokens, with model-inference payments handled through the x402 protocol. TIA is used as Eden’s gas token, giving the launch a direct connection to the asset.

TIA Tests Resistance as Four-Hour Momentum Remains Positive
Binance’s four-hour TIA/USDT chart shows TIA breaking above its earlier trading range around $0.60 before moving toward $0.75. At the latest displayed price of $0.717, the token remained above both moving averages shown: approximately $0.6904 for the shorter average and $0.6146 for the longer one. This supports the current bullish trend, although the latest candles also show some selling after the recent high.
The Relative Strength Index (RSI) stood near 68.51 on the chart, approaching the commonly watched overbought threshold of 70. That signals strong buying momentum but also leaves room for short-term profit-taking.
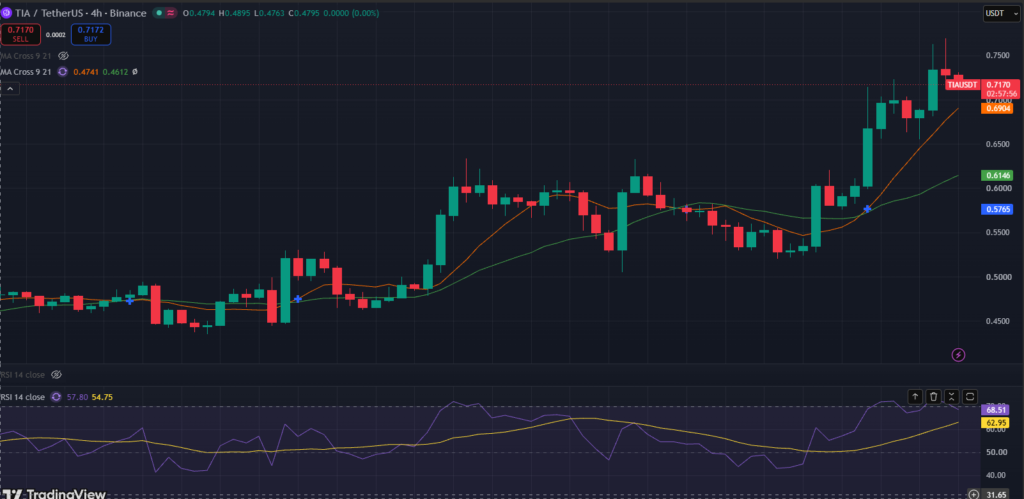
The 0.75–0.76 area is the immediate resistance to watch. A sustained move above it could extend the rally, while a retreat could bring 0.69–0.70 into focus as nearby support. The $0.61-0.62 region is a deeper reference zone if selling pressure increases.
Despite the positive momentum, Eden remains an experiment, and its long-term effect on TIA demand is not yet established.






Be the first to comment