


What to know:
- LINK’s symmetrical triangle pattern points to a possible breakout if the token clears $9.40 resistance.
- Analysts highlight a long-term bullish target near $60 if volume and market strength confirm.
- MACD crossover and Bollinger Band recovery suggest early bullish momentum building for LINK.

Chainlink (LINK) is moving in a bearish price trajectory as the general conditions in the crypto market have changed after the recent short-term rally. According to CoinMarketCap, the LINK price has surged by 3.17% over the last 24 hours and 3.62% over the last week.
At the time of writing, LINK is trading at $9.27, with a trading volume of $538.85 million, which has declined by 31.95% over the last 24 hours. However, its market capitalization stands at $6.73 billion, which is up by 3.16%.
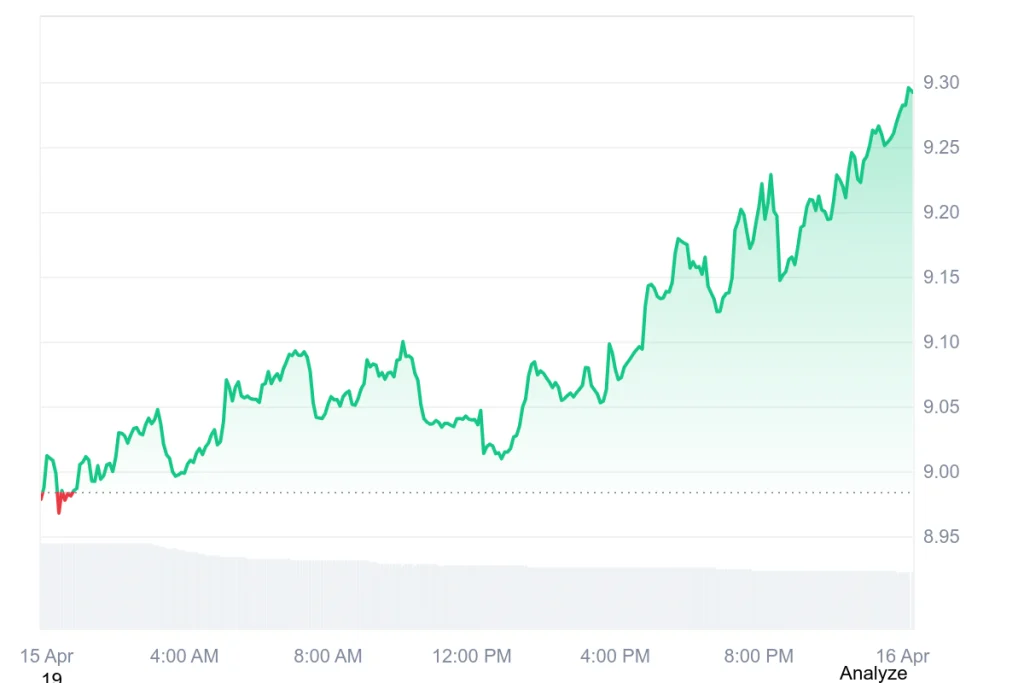
Source: CoinMarketCap

Also Read: Chainlink (LINK) Gains Momentum as Whale Accumulation Hits 3.3M Tokens
Chainlink (LINK) Signals Potential Breakout as Support Levels Hold
Furthermore, the crypto analyst Butterfly highlighted that LINK is currently holding firmly above the lower boundary of a symmetrical triangle on the 2-week chart, a key technical zone where buyers continue to defend price action.
This structure reflects tightening consolidation, with strong demand emerging at support. Repeated rebounds suggest accumulation is taking place as volatility compresses.

Source: Butterfly’s X Post
In case this level holds out, then it is likely that the momentum will turn upwards towards breaking the upper resistance line of the triangle pattern.
In case of such a breakout, there is a possibility of the resumption of the bullish trend, and the price may have the potential to go much higher to the level of $60.
Technical Indicators Support Ongoing Bullish Reversal
According to TradingView, LINK exhibits a highly volatile recovery stage in the context of an increasing Bollinger Band channel.
The sharp decline towards the $8.60 support point was followed by a recovery towards the $9.00 midpoint average. At its current position close to $9.26, LINK has encountered an instant barrier at the $9.41 upper limit of the Bollinger Band channel.

Source: TradingView
This is further supported by the movement of the blue line above the orange signal line on the MACD indicator.
This is followed by the change in the color of the histogram to green, which suggests an increase in buying pressure following the dominant bearish environment. Even as the price bounces back, it continues to stay within a larger two-week trading range of $9.40.
This article contains market analysis and price predictions. These are not guarantees. Crypto markets are volatile. Always DYOR. Not financial advice.
Also Read: Chainlink Price Prediction: 3 Powerful Signals Point to $12+ Breakout

Be the first to comment