



Ethereum and XRP fall as Sui confirms a MACD crossover. Key support and resistance levels and chart scenarios for SUI, Zcash, and Bittensor on October 7, 2026.
| Asset | Aggregate price | 24-hour change | Aggregate 24-hour volume |
|---|---|---|---|
| Ethereum | $2,613.93 | -3.15% | $14.10 billion |
| XRP | $1.47 | -2.06% | $2.04 billion |
| Sui | $1.15 | -3.61% | $609.53 million |
| Zcash | $1,325.88 | -1.08% | $770.65 million |
| Bittensor | $294.68 | -2.24% | $189.90 million |
Ethereum Volatility Contracts as the Live Price Tests Lower Support
Ethereum closed October 6 at $2,697.24 on Kraken, down 0.45% from $2,709.39. The session traded between $2,683.07 and $2,724.02, keeping the completed candle inside the range established during the previous several sessions.
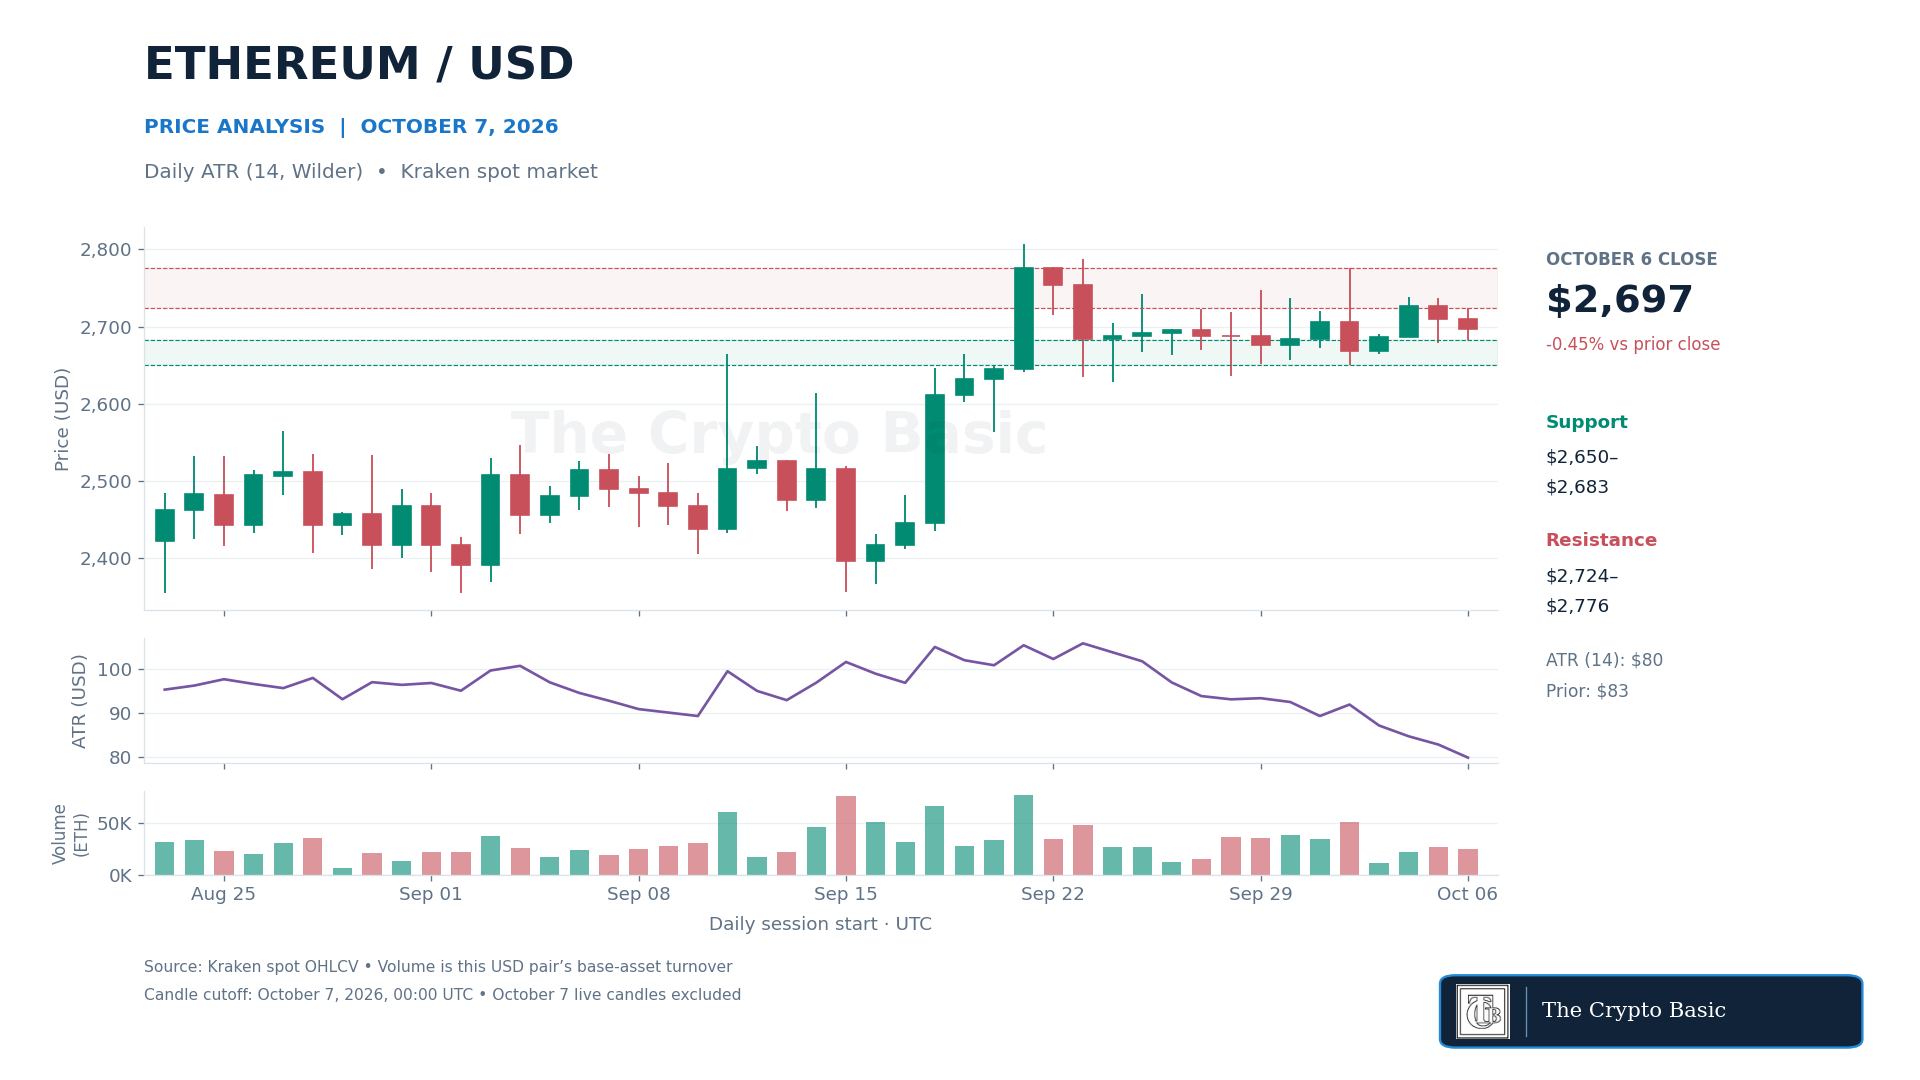
Daily average true range, calculated over 14 periods with Wilder smoothing, fell to $79.79 from $82.78. ATR measures recent trading-range size rather than direction. Its decline indicates that completed-candle volatility continued to contract even as Wednesday’s live market moved lower.
The $2,650.41–$2,683.07 area is the first completed-candle support zone. CoinGecko’s later $2,613.93 quote was already below it, but that remains an intraday break until the UTC session closes.

A daily close below $2,650 would expose the September 24 low near $2,627.68. One current ATR below the latest close is approximately $2,617, reinforcing this lower area as the next volatility-adjusted reference. A close below $2,617 would weaken the range further and place $2,583–$2,600 in view.
On the upside, ETH needs to reclaim $2,683 and then close above $2,724–$2,738. A completed break above that band would reopen the October 2 high at $2,776.46. The bullish scenario would weaken if price subsequently returned below $2,683.
XRP Tests Its 20-Day EMA Intraday
XRP price closed October 6 at $1.49698, down 0.70% from $1.50748. Its daily range narrowed to $1.49080–$1.52382, and the completed close remained above both selected exponential moving averages.
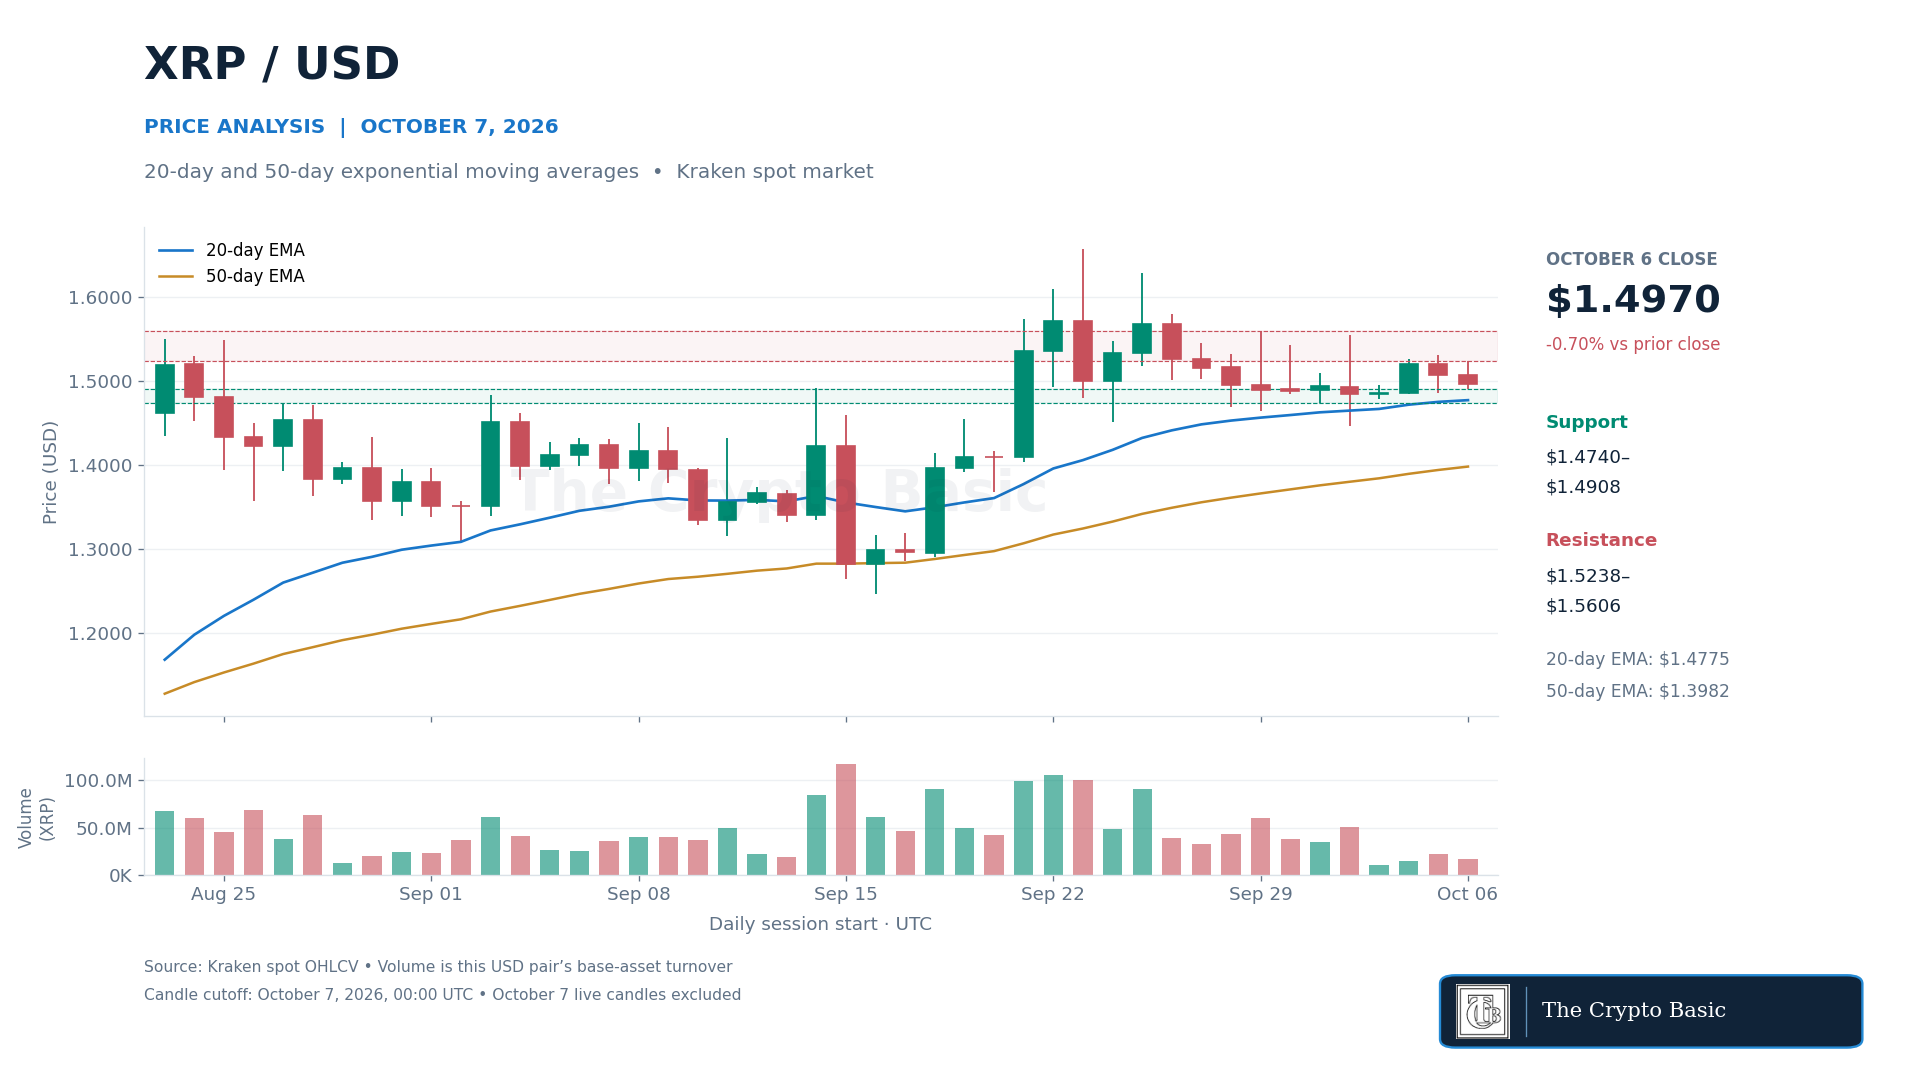
The 20-day EMA rose to $1.47751, while the 50-day EMA advanced to $1.39825. Their upward slopes and positive separation preserve the broader recovery structure on completed candles. However, the live $1.47 quote had moved slightly below the 20-day average by the market cutoff. That intraday move requires a daily close for confirmation.
A close below $1.4775 would weaken the near-term setup and expose the October 2 low at $1.44698. If that support fails, the 50-day EMA near $1.398 becomes the deeper dynamic reference, overlapping the earlier $1.39–$1.41 trading area.
For an upside recovery, XRP must first close above $1.52382. The stronger confirmation level remains the September 29 high at $1.56056; clearing it would reopen $1.61. A breakout that subsequently closes back below $1.52 would lose credibility.
Sui Confirms a Daily MACD Line-Signal Crossover
Sui closed October 6 at $1.1782, down 2.96% from $1.2142. The session low reached $1.1757 after the candle failed to retain an advance above $1.21.
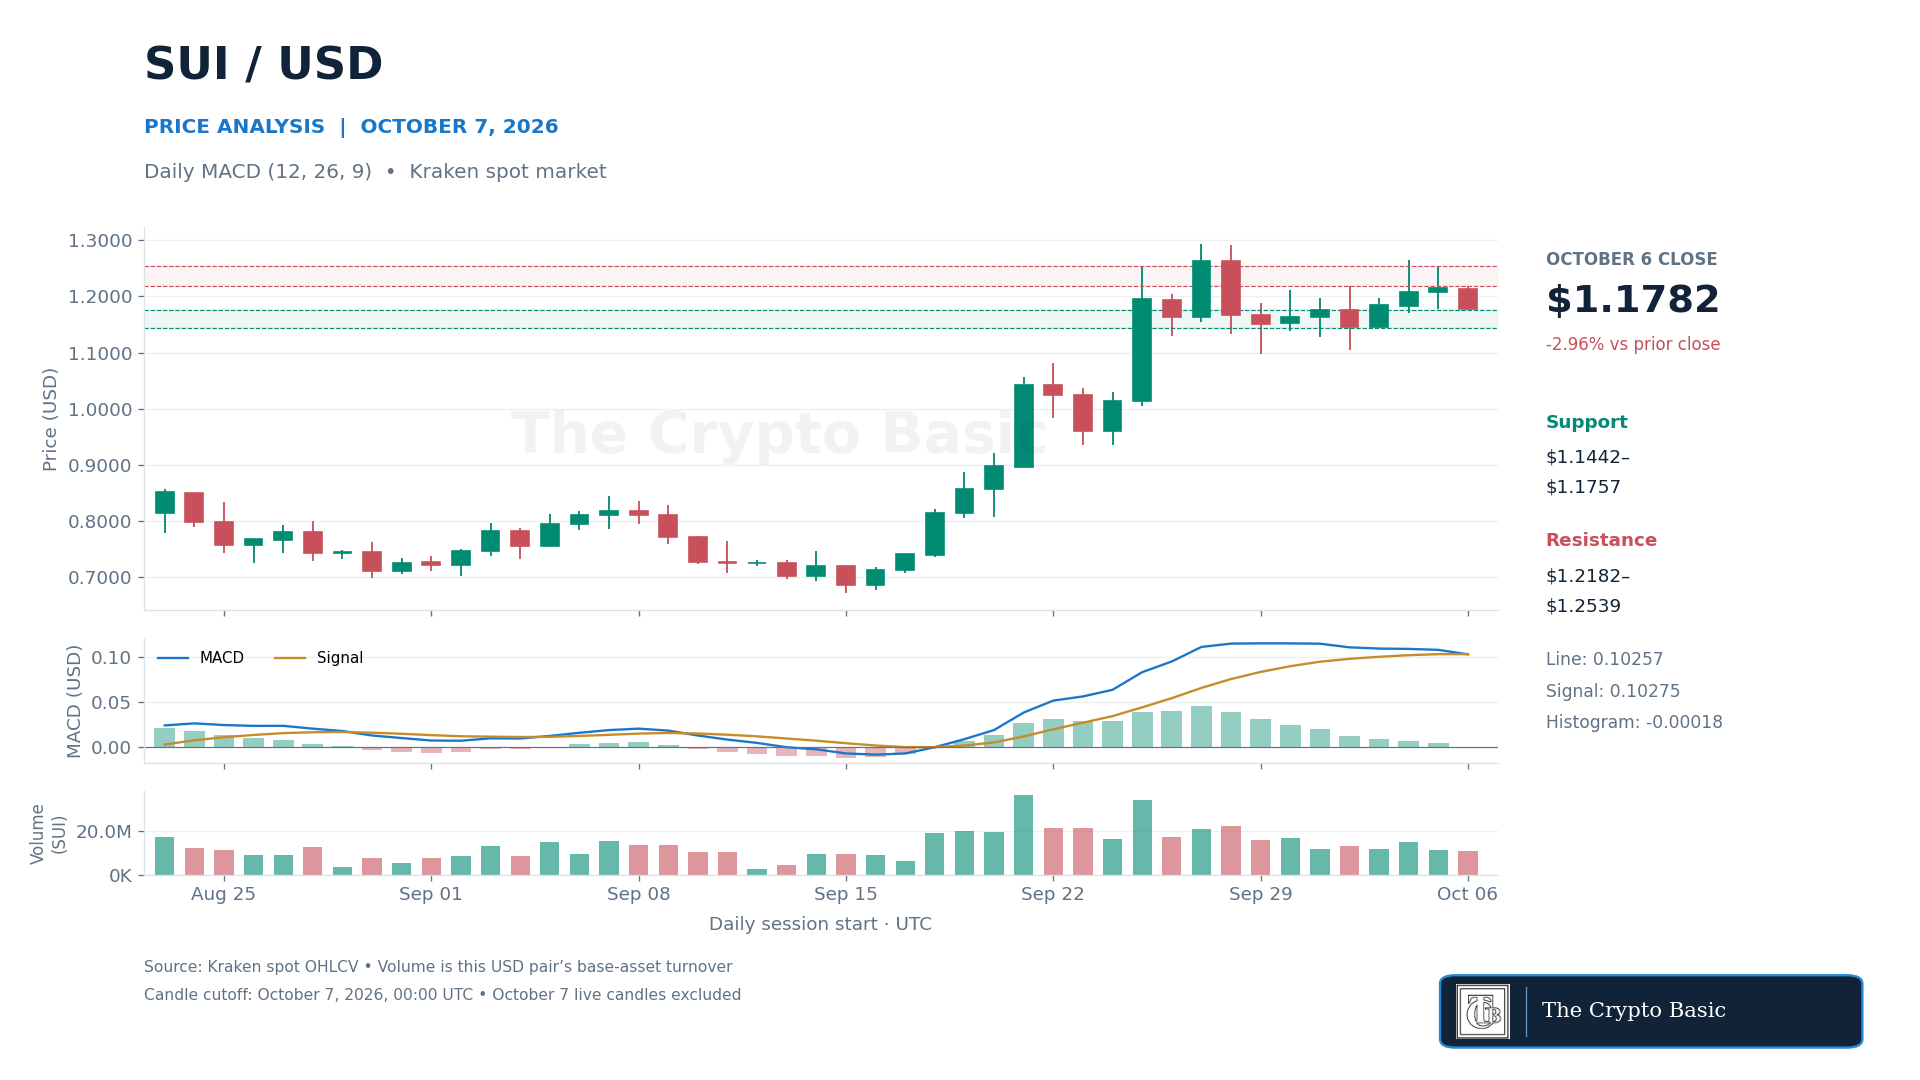
Daily MACD, using 12- and 26-period exponential averages with a nine-period signal line, recorded a confirmed bearish crossover on the completed candle. The MACD line eased to 0.10257, marginally below the 0.10275 signal line. The histogram changed from +0.00471 to -0.00018.
The crossover indicates that upward momentum has slowed enough for the MACD line to move below its signal, although both lines remain well above zero. The small negative histogram and elevated lines argue for a loss of momentum rather than an established long-term downtrend.
Immediate support spans $1.1442–$1.1757. The live $1.15 quote remained inside this zone. A daily close below $1.1442 would confirm a lower low and expose $1.1049–$1.0971.
Conversely, a close above $1.2182 would stabilize the structure, while clearing $1.2539 would reopen the late-September high near $1.293. A renewed MACD line move above the signal would support that recovery but should be assessed only after a completed candle.
Zcash Rebound Stalls Below the 38.2% Retracement
Zcash closed October 6 at $1,366.92, gaining 2.18% from $1,337.71. The session recovered from $1,318 to $1,385.20, but the live aggregate quote later returned to $1,325.88.
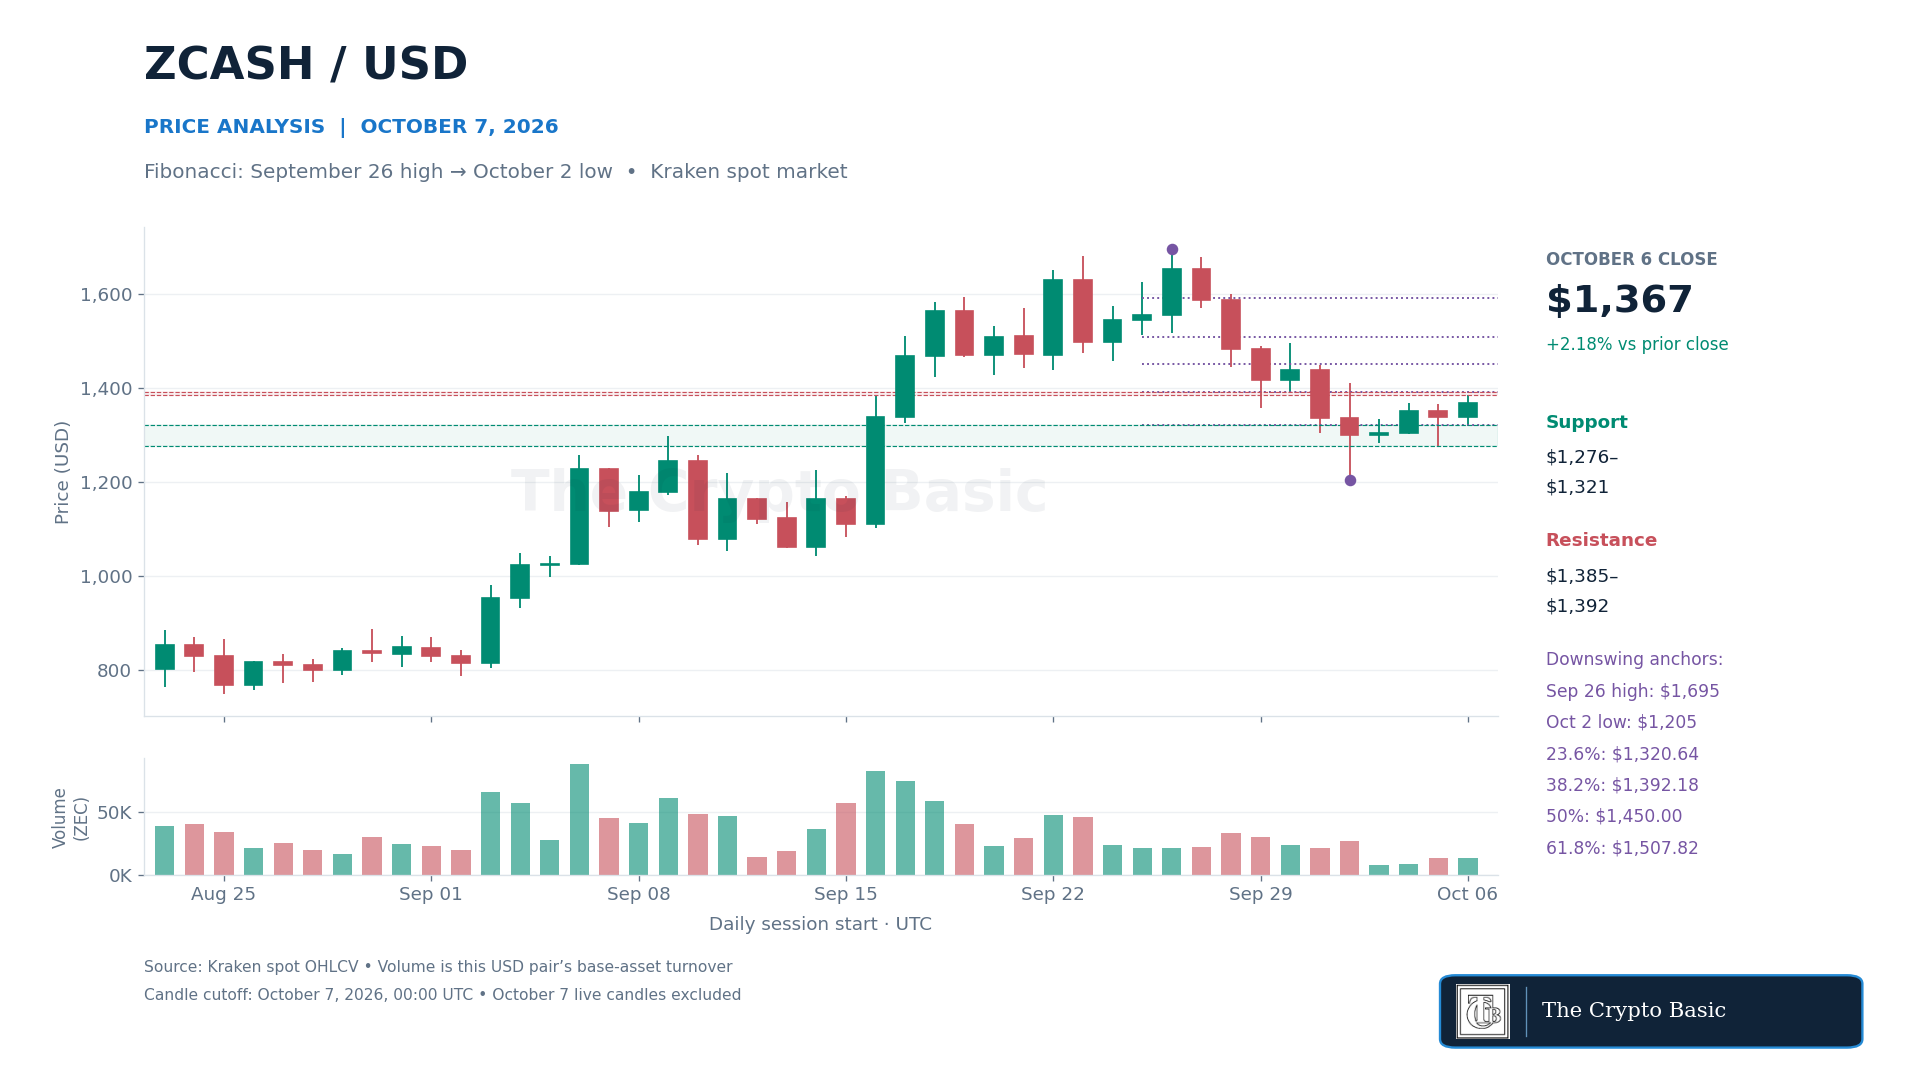
The Fibonacci map measures the rebound from the October 2 low of $1,205 following the decline from the September 26 high of $1,695. The 23.6%, 38.2%, 50% and 61.8% retracement levels are $1,320.64, $1,392.18, $1,450 and $1,507.82.
The completed close held above the first retracement but remained below 38.2%. A daily close above $1,392.18 would strengthen the recovery and place $1,450 in focus. Clearing the midpoint would open the 61.8% level, although these are conditional resistance references rather than assured targets.
On the downside, a close below $1,320.64 would surrender the first retracement and expose $1,276.19, followed by the $1,205 swing low. The live price was testing the first level at the cutoff but had not produced closing confirmation.
Bittensor Price Rises While OBV Remains Nearly Flat
Bittensor closed October 6 at $308.74, up 0.98% from $305.76. The candle reached $309.01 but did not clear the October 5 high at $309.15 or the October 2 high at $317.
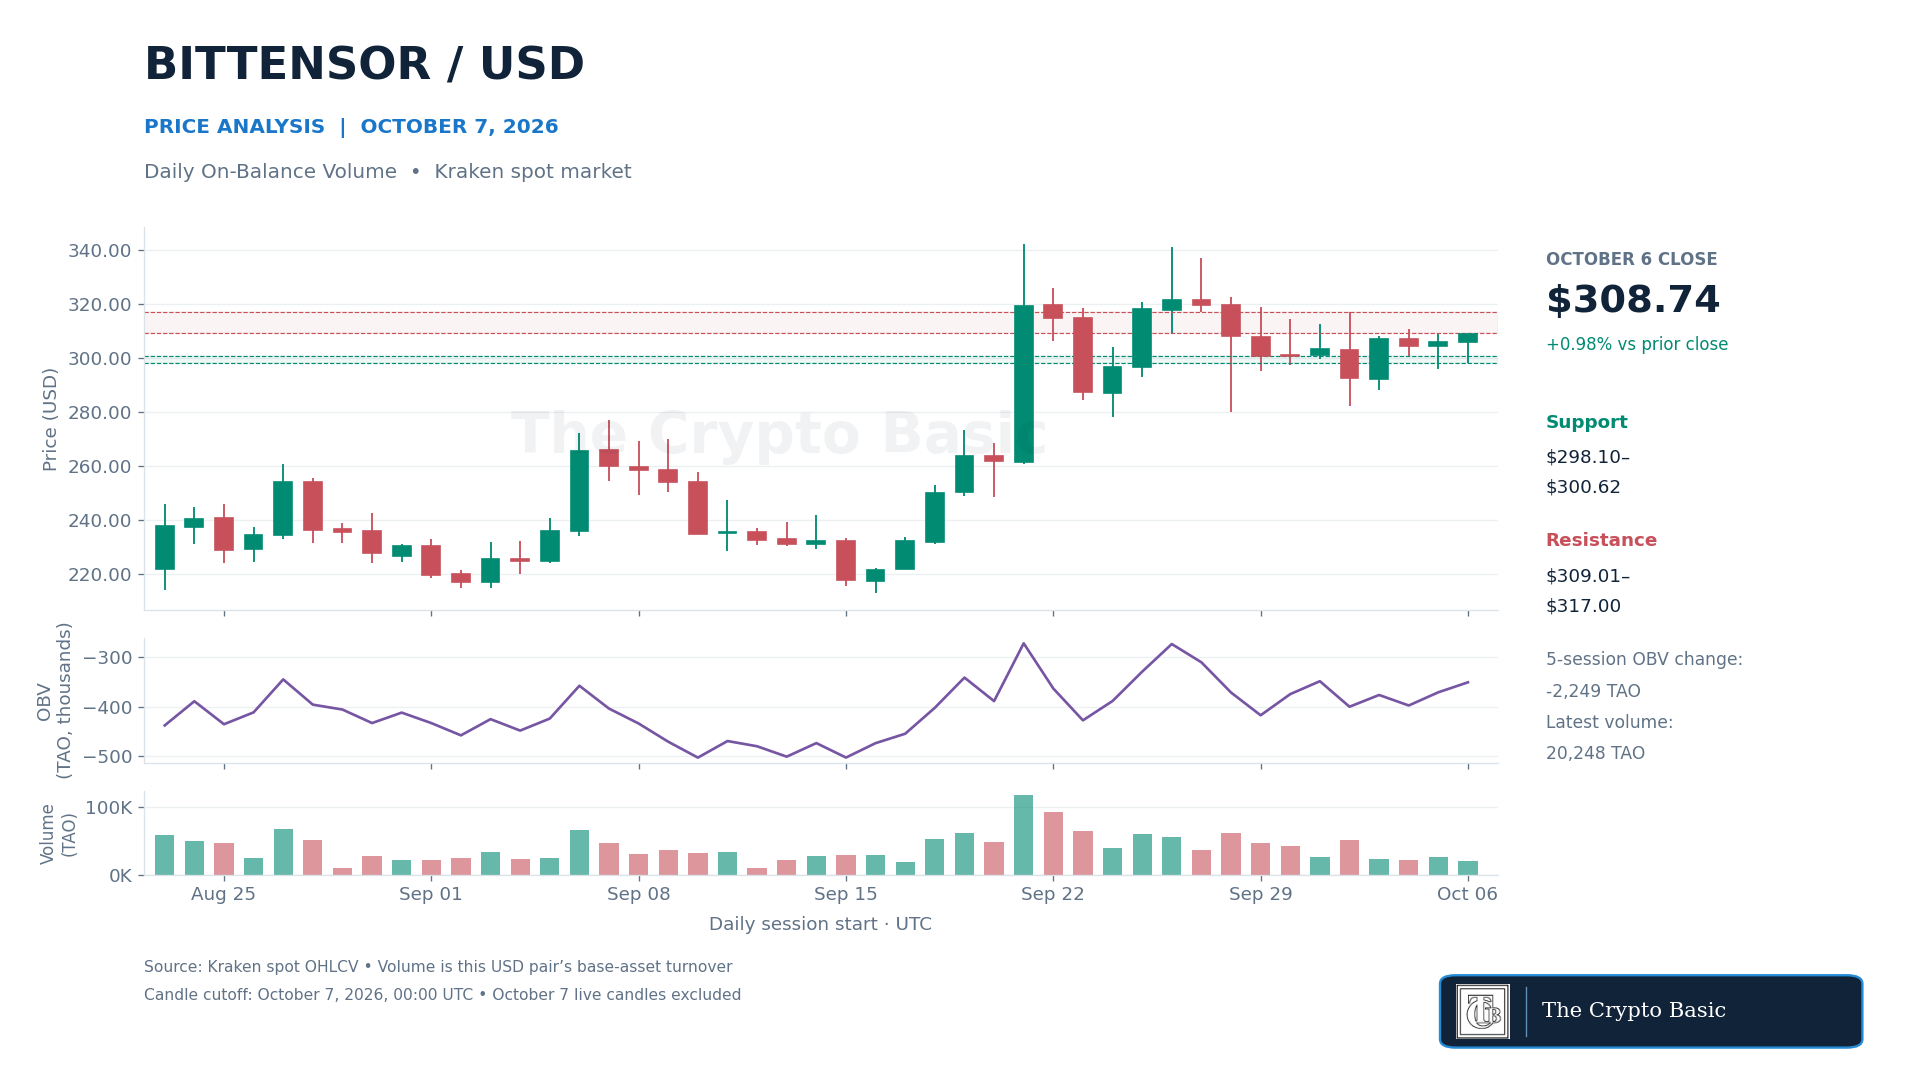
On-balance volume adds or subtracts each session’s Kraken TAO/USD volume according to the direction of the close. Across the latest five completed sessions, OBV declined by only 2,249 TAO, leaving it nearly flat while price rose from $292.43 to $308.74. October 6 volume totaled 20,248 TAO, approximately 41% of the preceding 20-session average.
The combination shows that the price recovery has not been accompanied by a decisive expansion in directional volume on this pair. It does not independently predict a reversal, but it reduces the strength of confirmation behind the latest higher close.
A daily close above $309.15 would improve the short-term setup, while clearing $317 would confirm a stronger range breakout toward $321–$342. The live $294.68 quote had moved below the $298.10–$300.62 support zone, but the move remains intraday.
A completed close below $298.10 would expose $288.11, followed by $282.31. A return below $309 after an upside break would invalidate the first breakout signal.



Be the first to comment