




TLDR
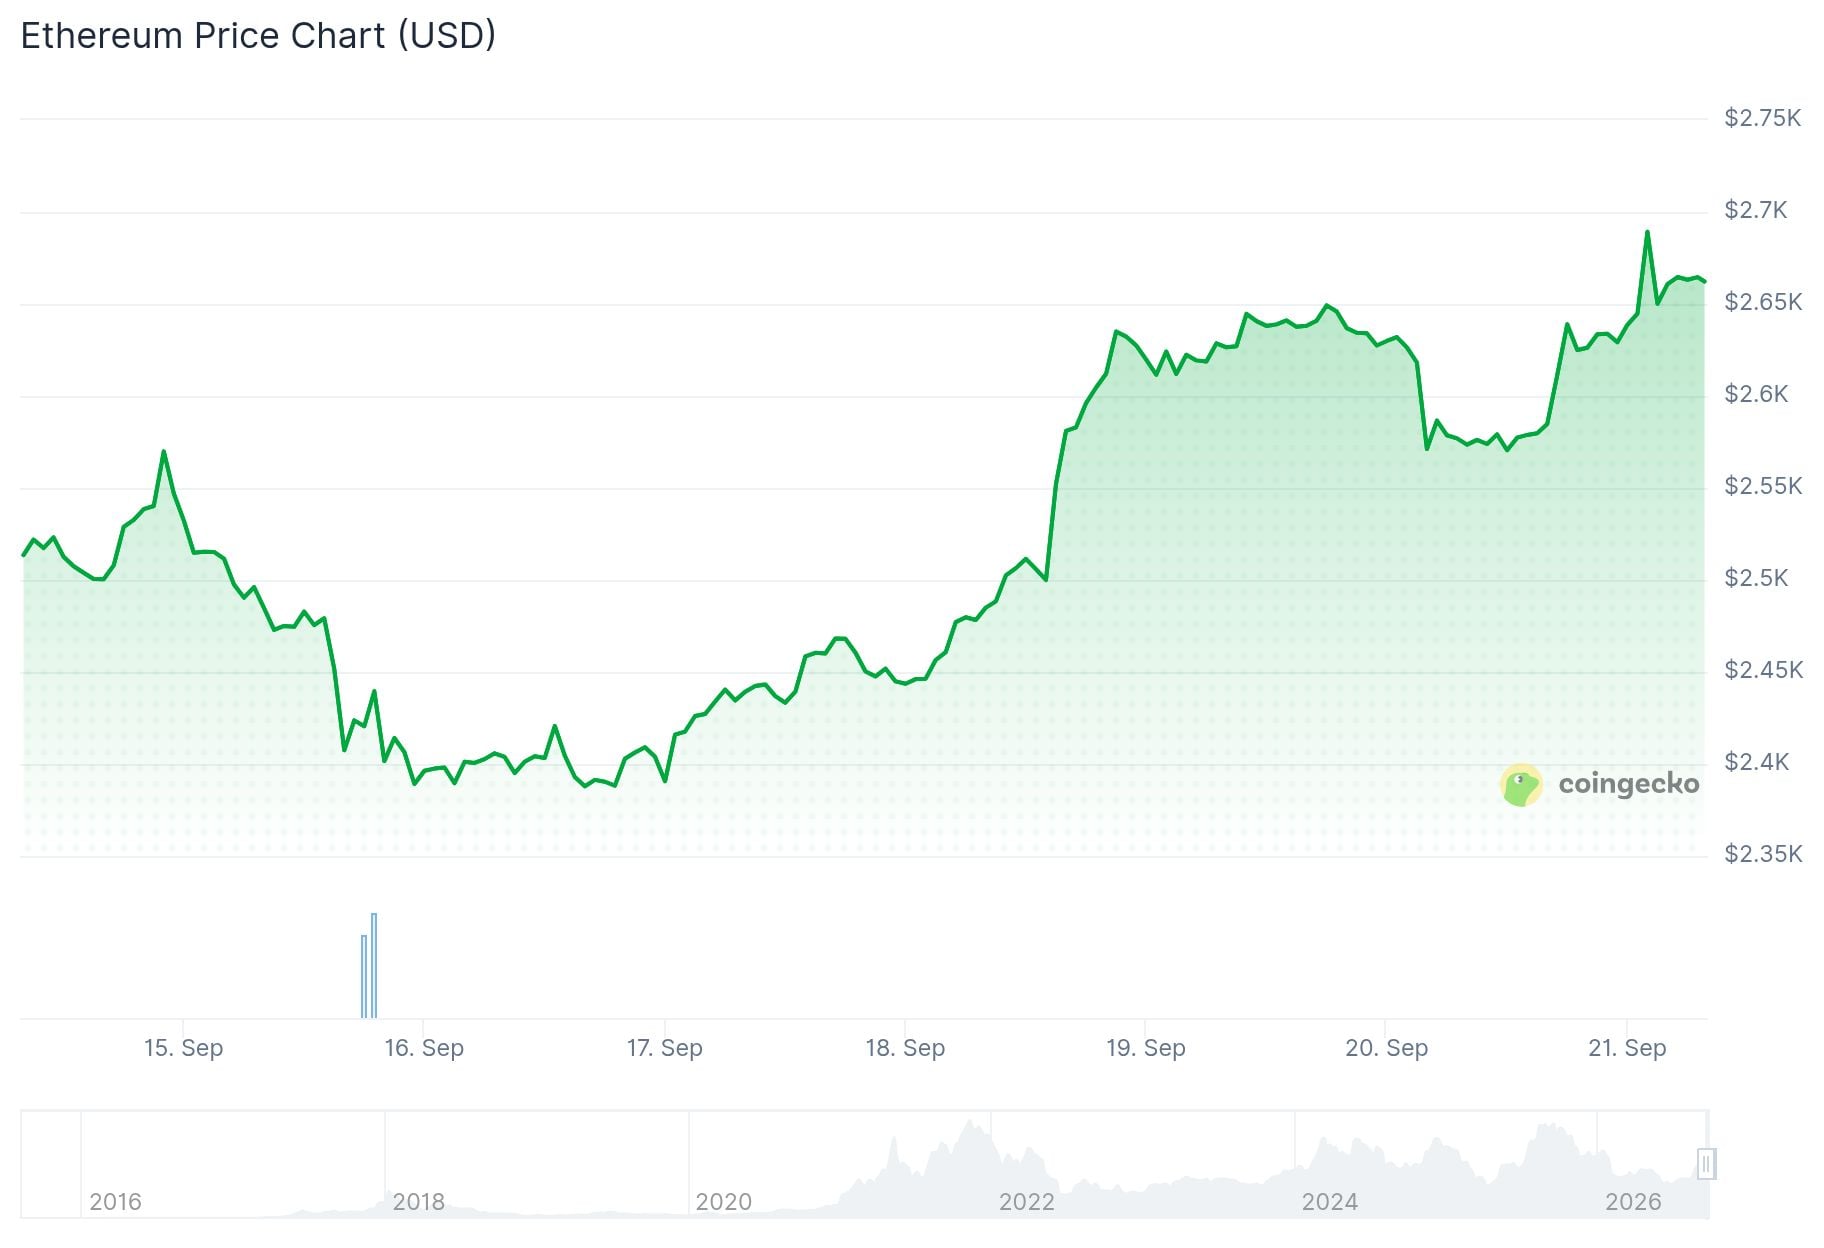
- Ethereum is trading around $2,664 after breaking above its recent September range.
- ETH pushed through the $2,560 area and has held that level on a retest.
- The daily chart shows price reaching $2,700, with $2,760 emerging as the next major target.
- RSI is at 67.16, showing strong momentum while still below the 70 overbought level.
- MACD has turned positive again, supporting the current breakout structure.
Ethereum (ETH) moved above $2,600 on September 21 after breaking through a resistance zone that had capped price for much of the past month.
ETH opened near $2,645 and reached an intraday high of $2,700. The token was trading around $2,664 at the time of the chart.
The latest move extends Ethereum’s recovery from its June low near $1,500. Since then, the daily chart has formed a series of higher lows.
A rising trend line from the June bottom remains intact. That trend line has supported the broader recovery through July, August, and September.
Ethereum accelerated higher in late August, moving from below $1,900 to above $2,300. Price then entered a tighter consolidation range before the latest breakout.
Breakout above $2,560 holds
The most important technical development is the move above the $2,560 area. ETH broke through that level and has since remained above it.
Analyst Ali Charts described the move as a confirmed breakout. In a post on X, he said Ethereum had broken above $2,560, successfully retested it as support, and was now pushing higher.

Ali Charts added that he is watching $2,760 as the next major target while the breakout remains intact.
ETHEREUM BREAKOUT CONFIRMED$ETH broke above $2,560, successfully retested it as support, and is now pushing higher.
With the breakout holding, I’m watching $2,760 as the next major target. https://t.co/JfsSCIMGZk pic.twitter.com/j1pP0i6H8b
— Ali Charts (@alicharts) September 20, 2026
That level sits above the current intraday high of $2,700. A move through $2,700 would therefore put the $2,760 area directly in focus.
The former $2,500 to $2,560 resistance zone is now the main nearby support area on the chart. Holding above that range would keep the breakout structure in place.
Momentum indicators strengthen
Ethereum’s momentum indicators have also improved. The daily Relative Strength Index is currently at 67.16.
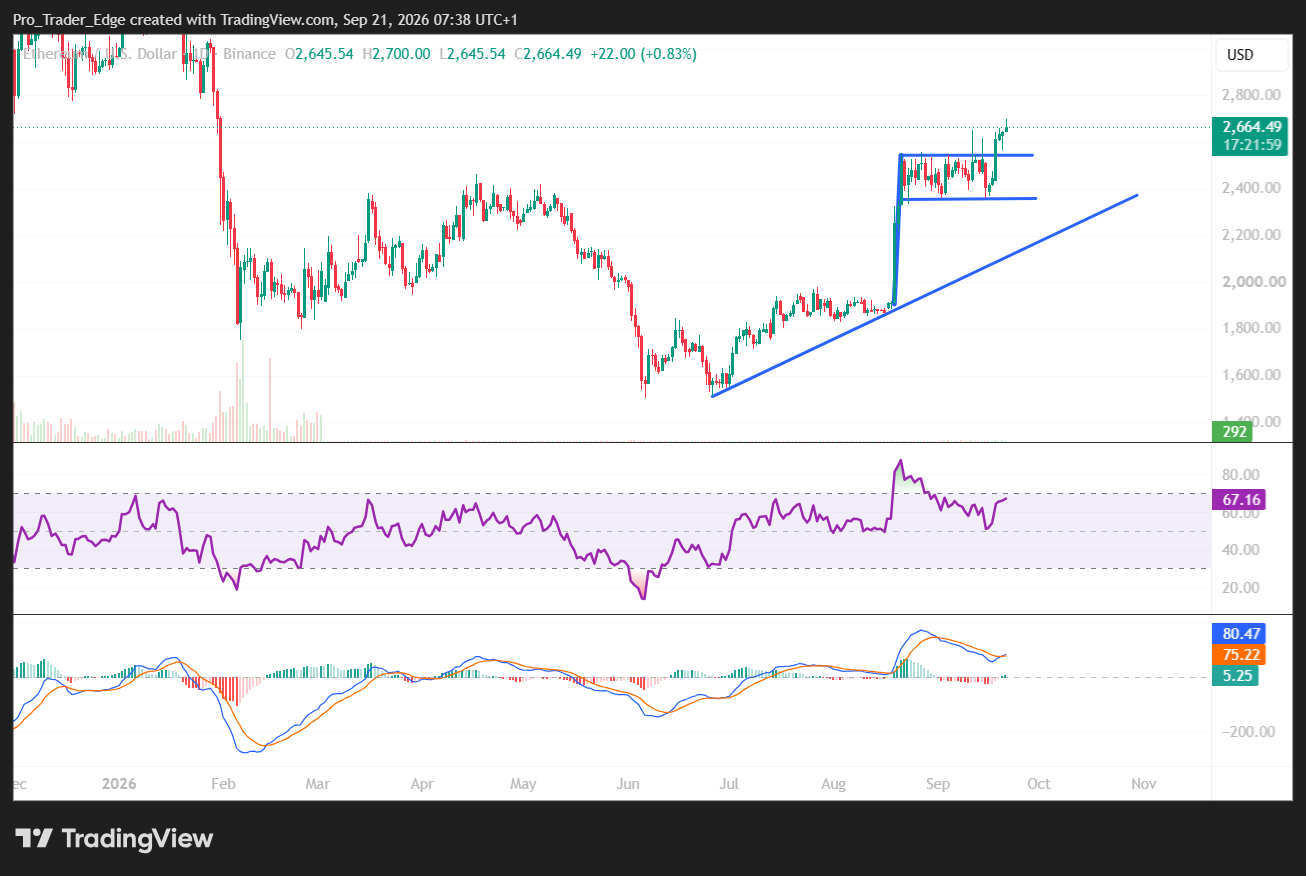
That places RSI below the commonly watched 70 overbought level. The reading shows buying pressure has increased without moving into clearly overbought territory.
MACD is also turning higher again following the September consolidation. The MACD line is around 80.47, compared with the signal line at 75.22.
The histogram has moved back into positive territory at about 5.25. This suggests short-term momentum has strengthened alongside the breakout.
The wider chart still shows Ethereum below the levels seen around the beginning of 2026, when ETH traded close to $3,000.
For now, ETH is holding above the $2,560 breakout area after reaching $2,700, while Ali Charts is watching $2,760 as the next major upside target.



Be the first to comment