


Ethereum traded at $2,412.07 on Friday evening, down 1.85 percent on the day and 2.84 percent on the week (CoinGecko, as of October 16, evening). At the same time, the amount of Ethereum sitting on centralised trading venues is at its lowest in years. Put those two facts together and you get the story doing the rounds this weekend: supply on exchanges is shrinking, so the price has to rise. That equation does not add up, and the reason sits in the same data set.
An exchange reserve is the amount of a cryptocurrency held in the accounts of trading venues, ready to be sold without any further step. When it falls, balances are moving into self-custody, into staking, or into products that tie them up for longer. Less of it is available for immediate selling pressure. That is the half of the story almost every report this week tells. The other half: if hardly anyone is buying at the same time, demand is missing the very counterpart that turns scarce supply into a rising price.
Ethereum exchange reserves are at a multi-year low
The figure everyone cites comes from CryptoQuant and was analysed by Finbold on October 9: the 30-day average of Ethereum held across all trading venues stood at 14,742,387.9 ETH. On July 18, 2025 it was 21,124,548.6 ETH. That is 6,382,160.7 ETH drained since then, a fall of 30.21 percent. At today’s price, the amount that has left is worth around $15.4 billion.
The 30-day average is the more honest measure here than a daily reading. It smooths out the internal transfers an exchange makes between its own addresses, which show up in raw data as a routine 200,000 ETH outflow. Read a daily number without the average and you are often measuring bookkeeping rather than movement.

Binance loses 430,000 ETH in just over seven weeks
The picture sharpens at the largest exchange. Between August 25 and October 16, the Ethereum balance on Binance fell from 3.90 million to 3.47 million ETH. That is 430,000 ETH less, down 11 percent in 52 days. The analysis comes from CryptoQuant contributor Amr Taha and was summarised by Blockchainreporter on October 16.
430,000 ETH is worth roughly $1.04 billion at Friday’s price. That sounds like a wave, but set against daily trading volume of $12.68 billion it is the amount that changes hands several times over on a quiet session. The number gains weight only through its direction across several weeks.
How a falling exchange reserve works on the price
The mechanism takes two sentences. On an exchange, buy and sell orders meet in an order book, and only someone whose balance sits there can sell. The less balance there is, the thinner the sell side, and the further a mid-sized buy order pushes the price up.
That same thinness cuts both ways. A thin order book lets the price slide down just as quickly on sales. That was visible on October 15, when $489 million of leveraged positions were force-closed within an hour. A low exchange reserve is no promise about price, it is an amplifier.

Spot volume halves, and the reading shifts with it
Over the same period in which Binance lost 430,000 ETH, the seven-day average of spot volume across the major venues fell from $6.73 billion to $3.125 billion. That is a drop of 53.6 percent. Spot volume is trading in the cryptocurrency itself, without leverage and without derivatives, which makes it the most direct measure of real demand.
There is also a second figure missing from most reports: USDT reserves on Binance fell by 2.3 percent, a net outflow of roughly $175 million in stablecoins. Stablecoins on an exchange are purchasing power waiting for an entry. When that purchasing power leaves the venue alongside the Ethereum, both sides are walking out, not just the seller.
Two CryptoQuant analysts, two conclusions
What stands out this week is that the same data leads two contributors at the same analytics firm to opposite verdicts. Amr Taha reads the outflow as support for the constructive long-term view on Ethereum: whoever takes a balance off an exchange rarely plans to sell it quickly. Contributor CryptoOnchain argues the other way, writing that there is still no trigger for rising prices, and points to the draining stablecoin reserves.
Both readings rest on documented figures, and neither has been disproved. The practical lesson is a single one: no one metric carries a decision. The exchange reserve says something about available supply, spot volume says something about demand, and only together do the two make a picture.
ETH against BTC: the exchange rate back at August levels
A second angle alongside the dollar chart is the ratio of Ethereum to Bitcoin. It shows whether a move affects the whole market or a single asset. On Friday evening one ether buys 29.37 thousandths of a bitcoin. The ratio was last lower on August 11, 2026. Thirty days ago it stood at 31.73 thousandths, and at the yearly high on October 21, 2025 it reached 36.69. The yearly low is 24.85 thousandths, set on June 7, 2026.
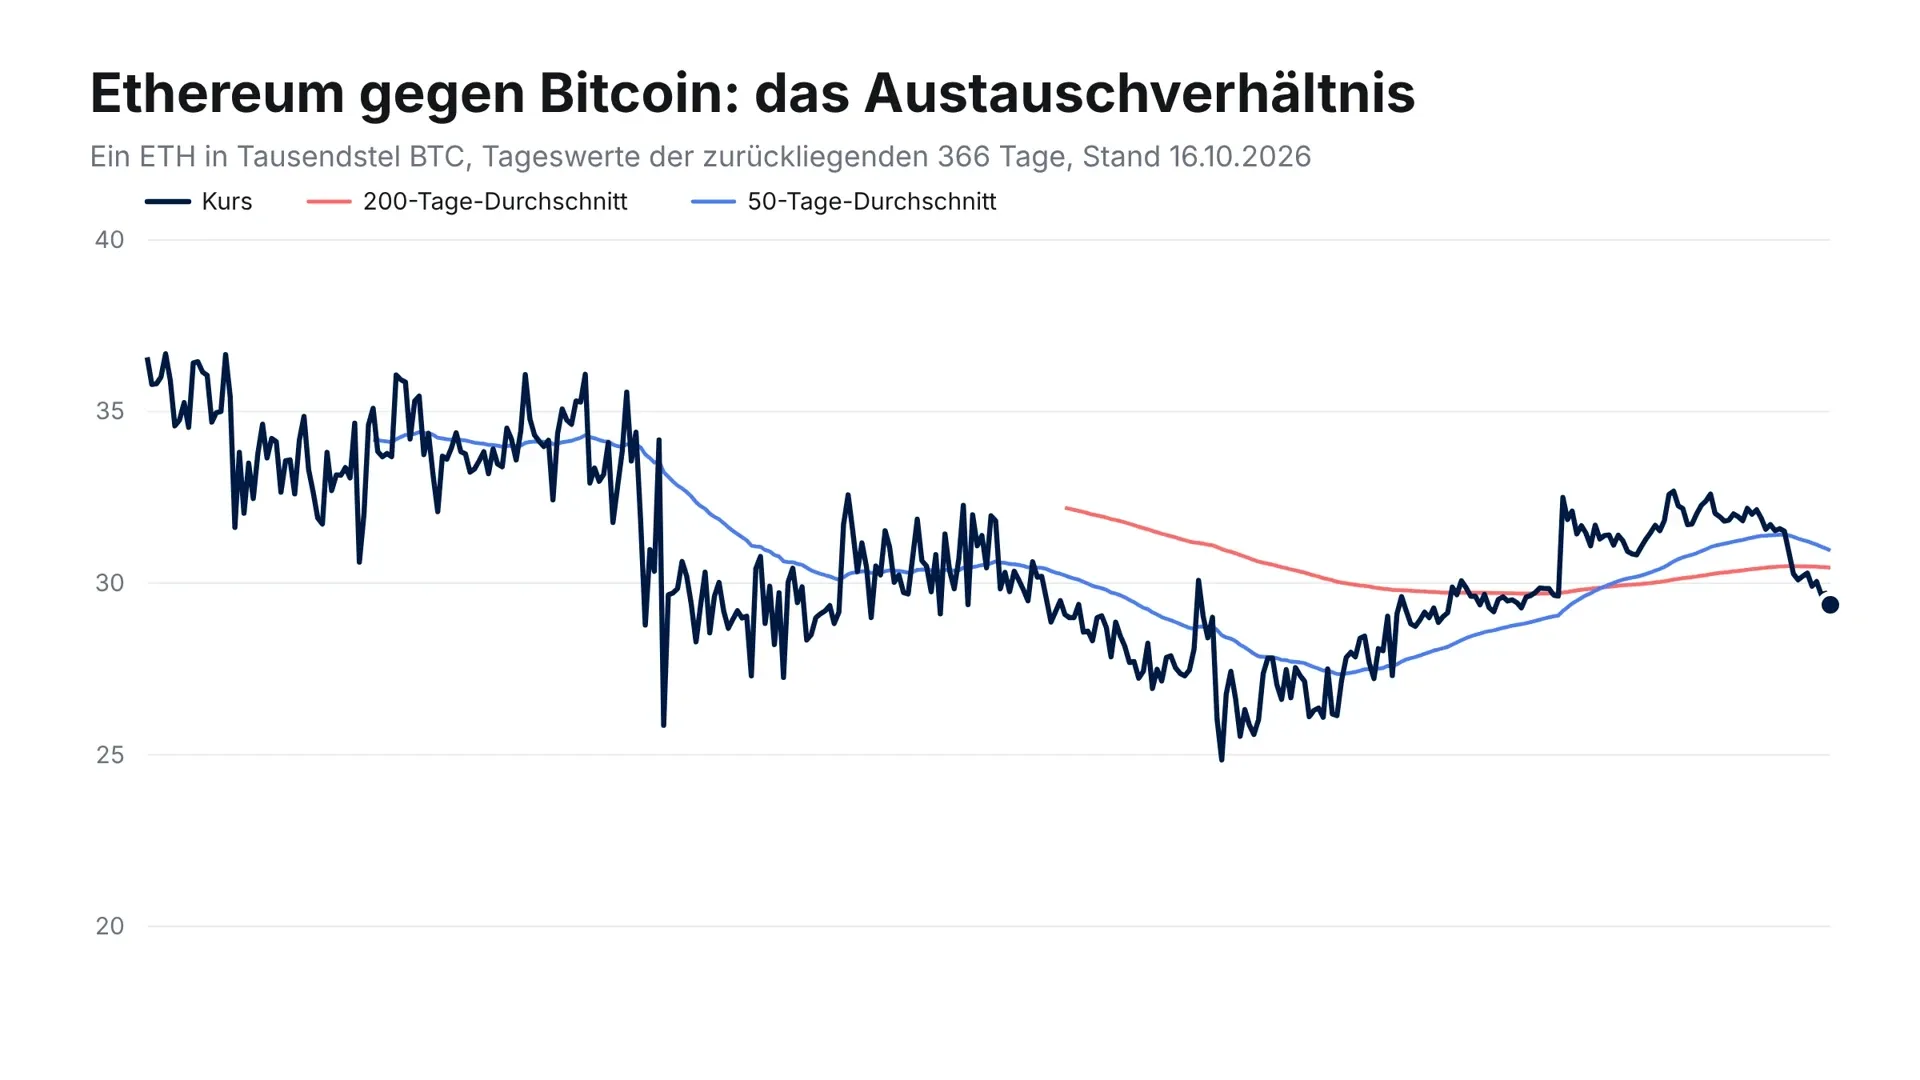
The implication is uncomfortable: the drain from exchanges has been running since July 2025, and the ratio to Bitcoin has fallen over the same stretch. A shrinking exchange reserve has so far given Ethereum no edge over Bitcoin. To test the scarce-supply thesis, test it on this line rather than on the dollar price, which largely follows the broader market.
The ETH price between $2,392 and $2,488 on Friday
Over the session the high was $2,488.84 and the low $2,392.90. The range of roughly $96 amounts to just under 4 percent. The market value of all ether stands at $294.6 billion, and the distance to the record of $4,946.05 is 51.2 percent.
Yesterday this spot carried a price of $2,380 and the question of whether the $2,400 level would hold; the detail is in our assessment from October 15. The level is holding so far: at $2,412.07 Ethereum sits 1.35 percent above yesterday’s reading, and the session low of $2,392.90 dipped below the mark only briefly. The next justified level above is the session high at $2,488.84, and below it the weekly low.
Taking ETH off an exchange means arranging custody you control yourself. Which devices do that at what cost, and what to get right during setup, is in our hardware wallet comparison. Add the network fee for the transfer to your exchange’s withdrawal fee before you settle on an amount; on small sums the two together eat the benefit quickly.
How to check the exchange drain yourself
No report is needed here, because the raw data is public. Three steps are enough. First, open the “Exchange Reserve” metric for Ethereum at an on-chain provider and set it to the 30-day average. Second, place spot volume over the same period beneath it. Third, compare the direction of the two lines. If both fall, the market has simply gone quieter. If only the reserve falls while volume holds, that does point to accumulation.
The same check works without a subscription, using the balance data published by exchanges that disclose their addresses. What matters is reading the same source over time. Figures differ between providers because each assigns different addresses to an exchange; the range of values published this week for all venues runs from 14.74 million to 14.88 million ETH.
The newsroom’s assessment of the exchange drain
Our assessment: the falling exchange reserve is a real signal, but no buy signal. The scale argues for it, since 6.38 million ETH since July 2025 is not an accounting entry but a shift into self-custody and into staking. Against it stands the second half of the same data: spot volume down 53.6 percent and $175 million in stablecoins taking the same route out. Supply becomes scarce only when someone bids for it. While volume falls, the outflow mostly describes fading interest in short-term trading.
Volume is where the counter-test becomes measurable. If the seven-day average climbs back above $5 billion while the reserve keeps falling, the scarce-supply thesis gains a foundation for the first time since August. If volume stays below $3.5 billion, the drain remains a footnote.
ETH at $2,412: the drain bites only once volume rises
Three steps for the weekend:
- Check the withdrawal fee before you transfer. Fees per withdrawal differ between venues by a multiple, and some charge a fixed amount of ETH rather than the actual network fee. Current terms are in the crypto exchange comparison.
- Decide whether your ETH should work. A large share of the amount that has flowed out is not sitting idle but staked. Which providers pay which yield, how long your balance is locked and what risk sits behind it is shown in the overview of staking platforms.
- If ETH stays on the exchange, check its licence. Since December 30, 2024 every provider in the EU needs MiCA authorisation to offer custody and trading. Which houses hold it is in the overview of regulated crypto exchanges.
(As of October 16, 2026. This article is not investment advice. Prices and fee structures change; check the terms with the provider before you buy.)






Be the first to comment