


Ethereum climbed to $1,930 on July 31 before reversing to $1,880, down 1.8% as resistance near the 100-day SMA held again.
Key Takeaways
- Ethereum was rejected inside the $1,915–$1,950 resistance area on July 30 and July 31.
- ETH reached $1,935 on July 31 before reversing just below the 100-day SMA at $1,940.
- Price has returned to the 0.382 Fibonacci retracement near $1,870, which has held for five sessions.
- Ethereum ETFs recorded a $13.29 million inflow on July 30 after an $18.65 million outflow on July 29.
Our previous Ethereum analysis identified the $1,915–$1,950 zone as the rebound’s main obstacle, and ETH has now been rejected there twice – first on July 30 and again on July 31.
The latest reversal has shifted attention back to the 0.382 Fibonacci retracement near $1,870.
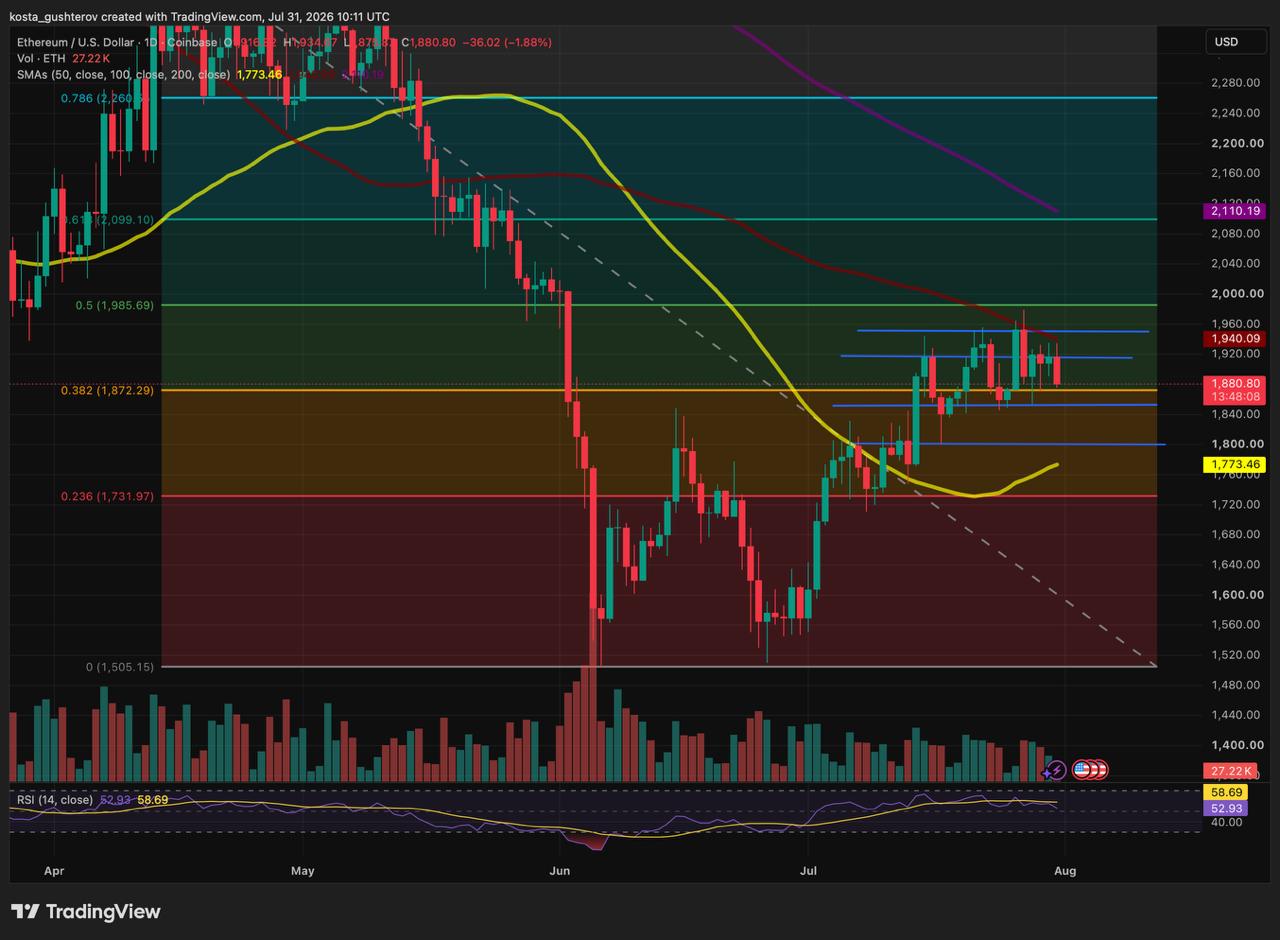
ETH Stalled Just Below the 100-Day SMA
The July 31 high nearly reached the 100-day moving average. Sellers entered before that point, inside the wider resistance area formed by the $1,920 level, the declining SMA and the upper boundary near $1,950.
The two recent failures show that buyers have yet to absorb the supply in this area. Another brief move above $1,920 would carry limited weight unless ETH can also clear the 100-day SMA and remain above it.
Momentum has not broken down despite the reversal. RSI stands at 58, above its signal line at 52.
ETH Is Back at the $1,870 Support
The 0.382 Fibonacci retracement sits near $1,870 and has stopped each pullback over the past five sessions.
Ethereum fell as low as $1,875 on July 31, bringing price within roughly $5 of the retracement.
A daily close below $1,870 would break the support that has held throughout the week. The next visible reaction areas sit near $1,850 and $1,800, where buyers previously interrupted the decline after ETH moved below the same Fibonacci level.
No Fresh Rate Hike Added to the Pressure
Neither of the week’s major central-bank meetings produced a rate increase.
The Federal Reserve kept its target range at 3.5%–3.75% on July 29, although three voting members preferred a 25-basis-point increase.
The Bank of Japan maintained its short-term policy rate at 1.0% on July 31. One member supported an increase to 1.25%.
The meetings did not add a new rate shock to the pullback, although the dissenting votes kept the possibility of further tightening in view.
ETF and Market Flows Remained Soft
The latest Ethereum ETF data from SoSoValue shows:
- July 30: $13.29M net inflow
- July 29: $18.65M net outflow
- Combined result: $5.36M net outflow
The July 30 inflow recovered most of the previous day’s outflow, leaving the combined result slightly negative.
CoinGlass spot and futures data also showed negative net flows during the latest periods at the time of publishing:
- Spot, 24 hours: $394.12M in, $436.05M out, net -$41.93M
- Spot, 3 days: $1.21B in, $1.26B out, net -$49.08M
- Futures, 24 hours: $7.80B in, $8.07B out, net -$267.24M
- Futures, 12 hours: $4.31B in, $4.68B out, net -$363.60M
The 12-hour futures outflow was $96.36 million larger than the full 24-hour figure, meaning the earlier half of the window was net positive by approximately the same amount.
In spot markets, the latest 24 hours accounted for roughly 85% of the three-day net outflow. Most of the weakness was therefore concentrated in the latest period, although the aggregated figures do not show exactly when the shift occurred.
Ethereum now sits between support near $1,870 and resistance from $1,915 to $1,950. A daily close below support would expose $1,850 and $1,800, while a close above the 100-day SMA and $1,950 would bring the 0.5 Fibonacci retracement near $1,985 into view.
- Disclaimer: This article is for informational purposes only and does not constitute financial or investment advice. Technical levels can fail, while flow data describes completed activity rather than future price direction.
- Methodology: Price levels, moving averages, Fibonacci retracements and RSI readings come from the ETH/USD daily chart on Coinbase dated July 31, 2026. The $1,880 price and 1.8% decline are intraday readings. ETF figures come from SoSoValue and cover July 29 and July 30. Spot and futures flow figures come from CoinGlass dashboards captured on July 31. The estimated $96 million earlier futures inflow and the 85% spot-flow concentration were calculated from the net figures.

Kosta has reported on cryptocurrency markets and blockchain infrastructure since 2020, bringing over six years of hands-on experience in the crypto industry built through daily tracking of markets, trends, and emerging blockchain developments. Specializing in Bitcoin on-chain analysis, institutional ETF flows, and digital asset price action, his work at Coindoo has been cited by other news agencies and consistently covers market developments with a focus on data-driven reporting across Bitcoin, Ethereum, Solana, and XRP.
Over the years, Kosta has contributed to multiple crypto media outlets in different regions, authoring over 6,000 articles across the sector. His reporting spans cryptocurrency markets and the broader fintech industry, tracking not only price action but also the technological and regulatory forces shaping the ecosystem.
To support his analysis, Kosta actively leverages on-chain data and metrics from leading platforms such as Santiment, Glassnode, and CryptoQuant, enabling deeper, evidence-based market insights. He believes in the power of transparency and the data that underpins the blockchain ecosystem.
His academic background in Marketing Management from Denmark further complements his analytical approach, adding a strong understanding of communication strategy and content positioning to his work.



Be the first to comment