



Ethereum price remains near $2,673 after an unsuccessful breakout attempt, making the $2,700 mark a crucial test for the bullish pennant highlighted by Ted Pillows.
As of press time, Ethereum trades at $2,672.90, a 0.19% decline over the last 24 hours. This setup is significant because a further push past $2,700 could decide whether ETH breaks free from its present consolidation or gets rejected once more.
Also Read: Ethereum Glamsterdam Upgrade Begins with Sepolia Testing on Oct. 6
Ethereum Price Stays Close to $2.67K
Ted Pillows pointed to the pattern on X, saying that Ethereum was “still in this bullish pennant” and that the earlier breakout attempt became a fakeout. He added that Ethereum needs “a strong close above $2.7K with decent spot demand” for confirmation.

That remark shifts attention to confirmation instead of an intraday climb beyond resistance. The chart reveals ETH squeezing between descending and ascending trendlines, forming a bullish pennant.
The 4-hour chart shared by Ted Pillows shows the pattern, while a confirmed close past the upper boundary would reinforce the setup. Another rejection would leave ETH within the range.
What Is the Ethereum Price Chart Indicating?
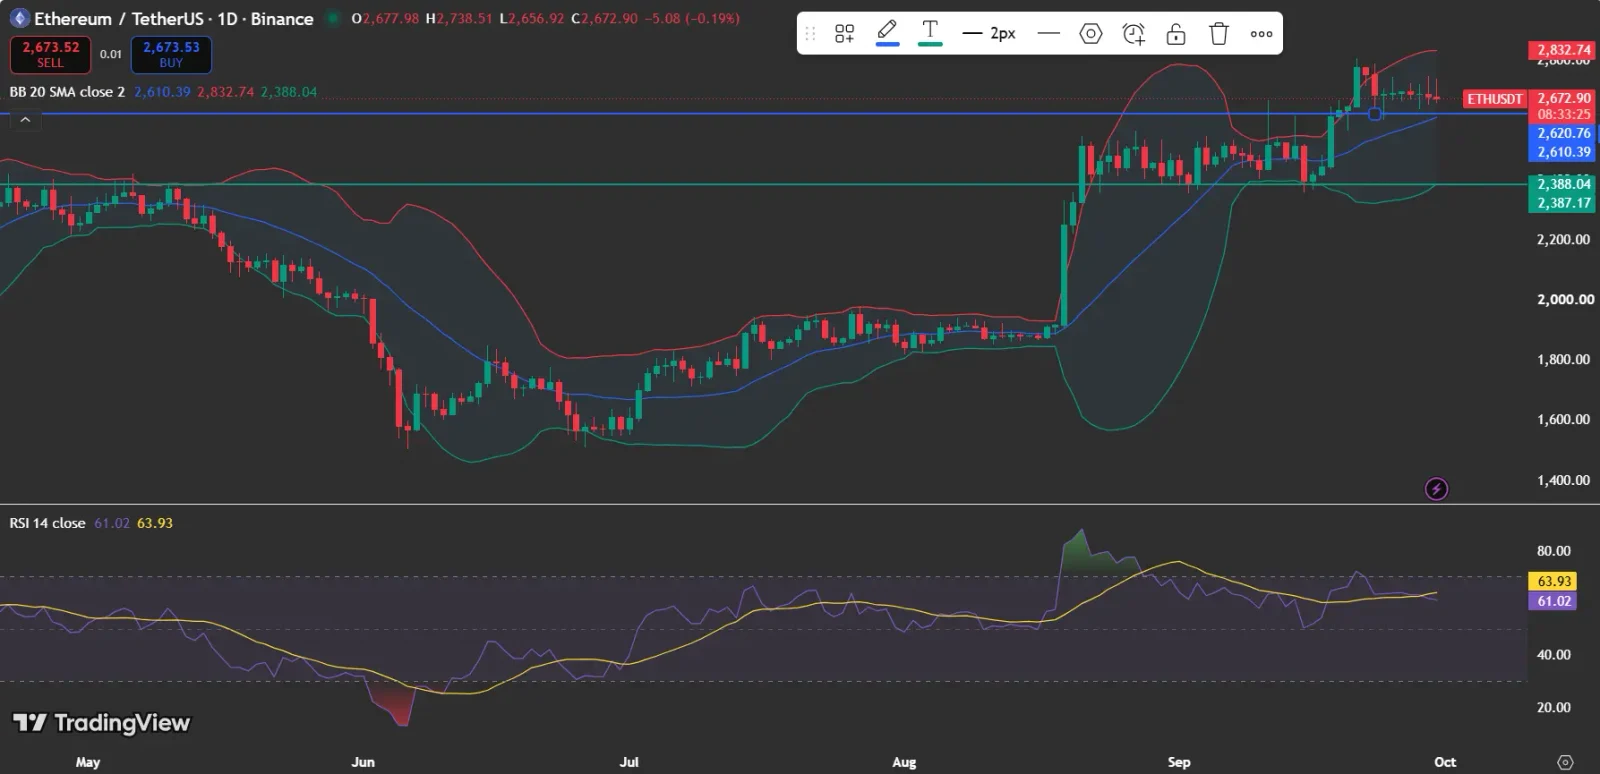
TradingView puts ETH at $2,672.90, beneath the $2,700 resistance zone. The Bollinger Band midpoint is $2,610.39, and the upper band stands at $2,832.74, leaving ETH space above its current price should momentum pick up.
The RSI reads 61.02, while its RSI moving average is at 63.93, indicating that momentum remains positive but has cooled slightly.
The RSI staying above 60 supports the broader bullish structure, but its position below the RSI average means the indicator is not giving a clean breakout confirmation.
Also Read: Ethereum Price Eyes $2,700 Breakout as ETF Inflows Rise
Could Ethereum Price Climb Above $2.7K?
A daily close beyond $2,700 would offer the clearest confirmation of the setup Ted Pillows described. The next upside level shown on TradingView is the upper Bollinger Band, around $2,833.
To the downside, $2,610.39 is a key technical reference since it lines up with the Bollinger midpoint. A drop beneath that zone would weaken the current momentum structure.
Also Read: Ethereum Holdings Top 6 Million as BitMine Stakes 5.07M ETH
How Do ETF Flows Influence Ethereum Price?
Activity around Ethereum ETFs has continued to be inconsistent. According to SoSoValue data, September 29 saw a net outflow of $2.81 million, after an inflow of $17.10 million on September 28. Sessions earlier in the period brought in larger inflows, such as $269.98 million on September 21 and $162.31 million on September 22.
Because of this recent cooling, ETF flows are not offering a steady, strong signal that a breakout is underway.
How Does CoinGlass Depict the Ethereum Price?
CoinGlass liquidation figures reveal occasional bursts of ETH liquidations, though more recent sessions have typically shown smaller liquidation bars.
The data shows that liquidation activity has continued around ETH’s price moves, but the supplied chart does not provide a current open-interest figure or enough detail to establish whether positioning is heavily skewed toward longs or shorts.
This means the CoinGlass data adds derivatives context but does not independently confirm the breakout.
What Does DeFiLlama Show About Ethereum Price?
DeFiLlama data likewise indicates Ethereum’s TVL is hovering in the $53 billion-$54 billion range, while the chart also tracks active addresses and transactions.
This provides broader network activity context while ETH tests resistance, although the supplied screenshot does not provide specific values for those two metrics in the visible chart.
Also Read: Ethereum Whales Show Strong Activity as ETH Price Eyes Further Upside
What Should Traders Keep an Eye On Next?
The essential confirmation is still a sustained close above $2,700. Maintaining that level would reinforce the bullish pennant setup, whereas repeated rejection could push ETH back down toward the $2,610 area.
As things stand, the technical outlook remains constructive but not yet confirmed. ETF flows and derivatives data provide mixed signals, which leaves the $2,700 level as the most obvious near-term decision point.
Cryptocurrency markets stay extremely volatile, so traders ought to watch price action, market sentiment, and upcoming catalysts before committing to investment decisions
Also Read: Chainlink CCIP 2.0 Cuts Ethereum Confirmation Times to Seconds
This article contains market analysis and price predictions. These are not guarantees. Crypto markets are volatile. Always DYOR. Not financial advice.



Be the first to comment