


Ethereum price traded near $2,450 on Aug. 26 after a sharp weekly rally stalled below $2,550, while its 4-hour chart formed a potential bull flag that could decide the next major move.
Summary
- Ethereum price remains around $2,450 after reaching a seven-day high near $2,546.
- A 4-hour bull flag places immediate resistance between $2,500 and $2,550.
- Daily RSI has reached 75.59, showing strong but overextended momentum.
- CoinGlass data shows major liquidation clusters near $2,550 and $2,300.
Ethereum price consolidates after its weekly surge
According to data from crypto.news, Ethereum (ETH) price was trading at $2,452 at the time of writing, holding most of the gains produced by last week’s sharp breakout.

ETH opened at $2,251.44 on Aug. 20 and rose to an intraday high of $2,545.88 the following day. Its move from the Aug. 20 opening price to the weekly high represented a gain of about 13%.
The advance becomes larger when measured from the consolidation zone near $1,900 that preceded the breakout. Ethereum gained nearly 34% between that level and the weekly peak before buyers and sellers reached a temporary balance.
Price has since remained largely between $2,400 and $2,500. That tight range shows that traders have not fully reversed the rally despite the failure to extend above $2,550.
The recovery also marked a clear shift from Ethereum’s earlier weakness. ETH had spent much of August moving sideways below $1,950 before breaking through $2,000 and accelerating toward $2,500.
US investors are also watching broader liquidity conditions after falling bond yields supported a recovery across risk assets. Crypto traders will now assess whether those conditions can sustain spot demand after the initial rally and market-wide short squeeze.
Ethereum bull flag points to $2,550 resistance
The 4-hour ETH/USDT chart shows price consolidating within a downward-sloping channel following its near-vertical move from approximately $1,900.
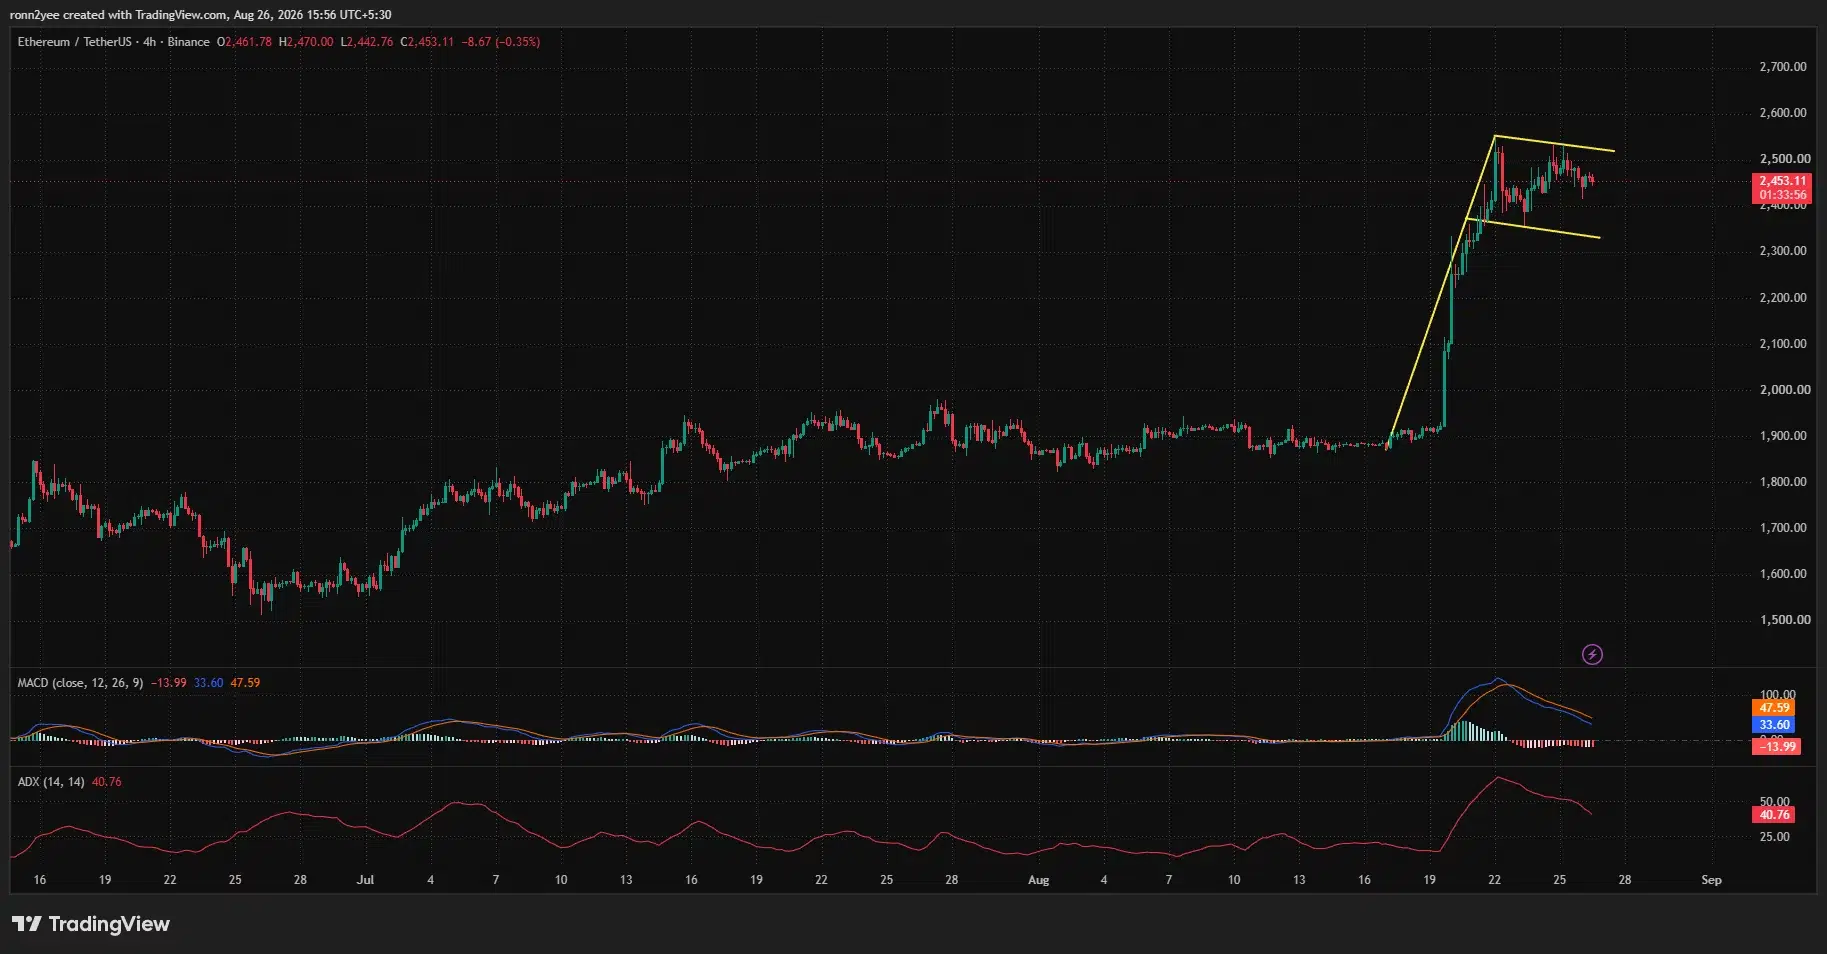
Such a structure can develop into a bull flag when it follows a strong advance. Confirmation would require Ethereum to close above the channel’s upper boundary, currently located around $2,510 to $2,530.
A successful breakout would bring the recent $2,546 high into focus. Buyers would then need to establish support above $2,550 before targeting higher levels.
Crypto analyst Ted Pillows identified the same area as the main barrier to another leg higher. In an Aug. 26 post on X, Pillows said Ethereum needed a weekly close above $2,550 to open a possible move toward $3,000.
The $3,000 target is not confirmed by the current chart because ETH remains below the breakout level. A weekly rejection around $2,500 to $2,550 could instead keep the price inside its short-term consolidation pattern.
The lower boundary of the 4-hour flag currently sits between $2,330 and $2,360. A break below that area would weaken the continuation setup and raise the probability of a deeper pullback.
Momentum cools as daily RSI reaches 75
Ethereum’s daily chart remains bullish, but its momentum readings show that the rally has become stretched.
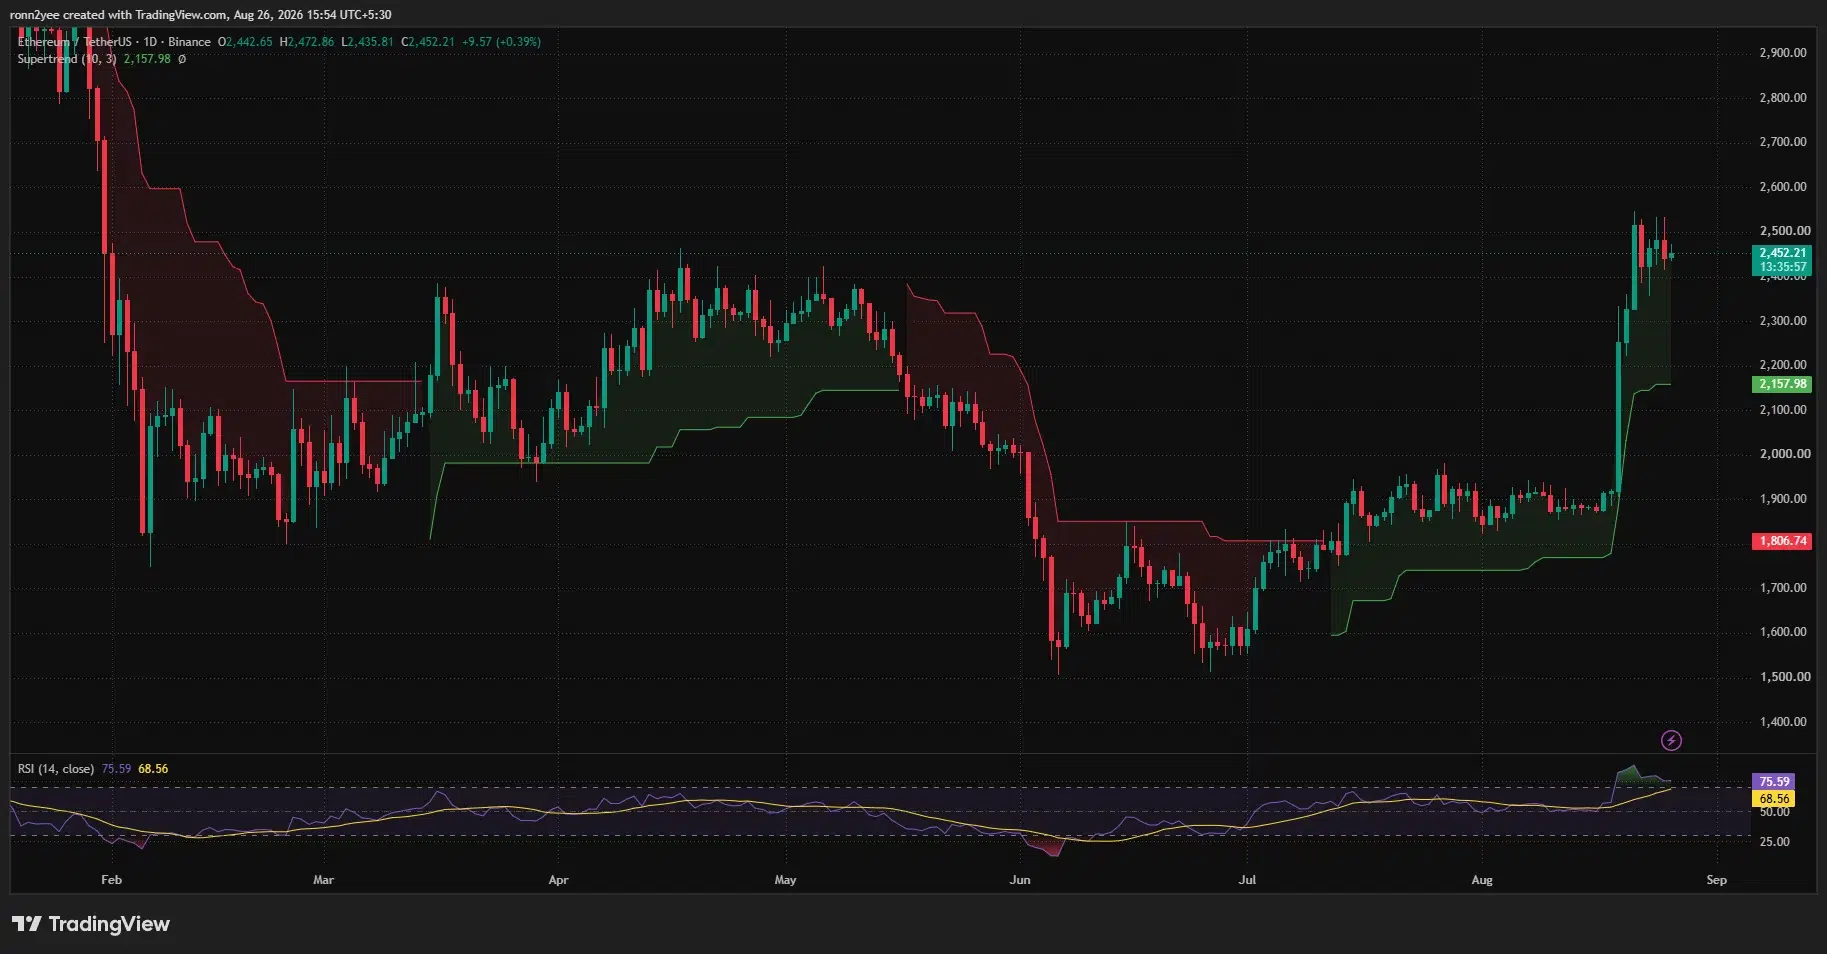
The daily Relative Strength Index stood at 75.59, above the commonly watched overbought threshold of 70. Its RSI moving average was lower at 68.56.
An overbought RSI does not guarantee that the price will fall. It shows that buying accelerated quickly and that Ethereum may require consolidation or a pullback before attempting another sustained advance.
The Supertrend indicator remains positive and places broader trend support at approximately $2,158. ETH is trading almost 14% above that level, leaving room for a correction without fully reversing the daily bullish structure.
Shorter-term momentum has already started to weaken. On the 4-hour chart, the Moving Average Convergence Divergence line stood at 33.60, below its signal line at 47.59. The histogram had fallen to negative 13.99, reflecting slowing momentum after the initial breakout.
The Average Directional Index remained elevated at 40.76, which indicates that the preceding trend was strong. However, the ADX has turned lower from its recent peak, adding evidence that the rapid advance is losing force while ETH trades sideways.
Together, the indicators suggest that Ethereum’s larger recovery remains intact, but the next move may depend on whether buyers can absorb profit-taking above $2,500.
Liquidation clusters frame Ethereum’s next move
CoinGlass’ one-week Ethereum liquidation heatmap shows substantial leveraged positions on both sides of the current price.
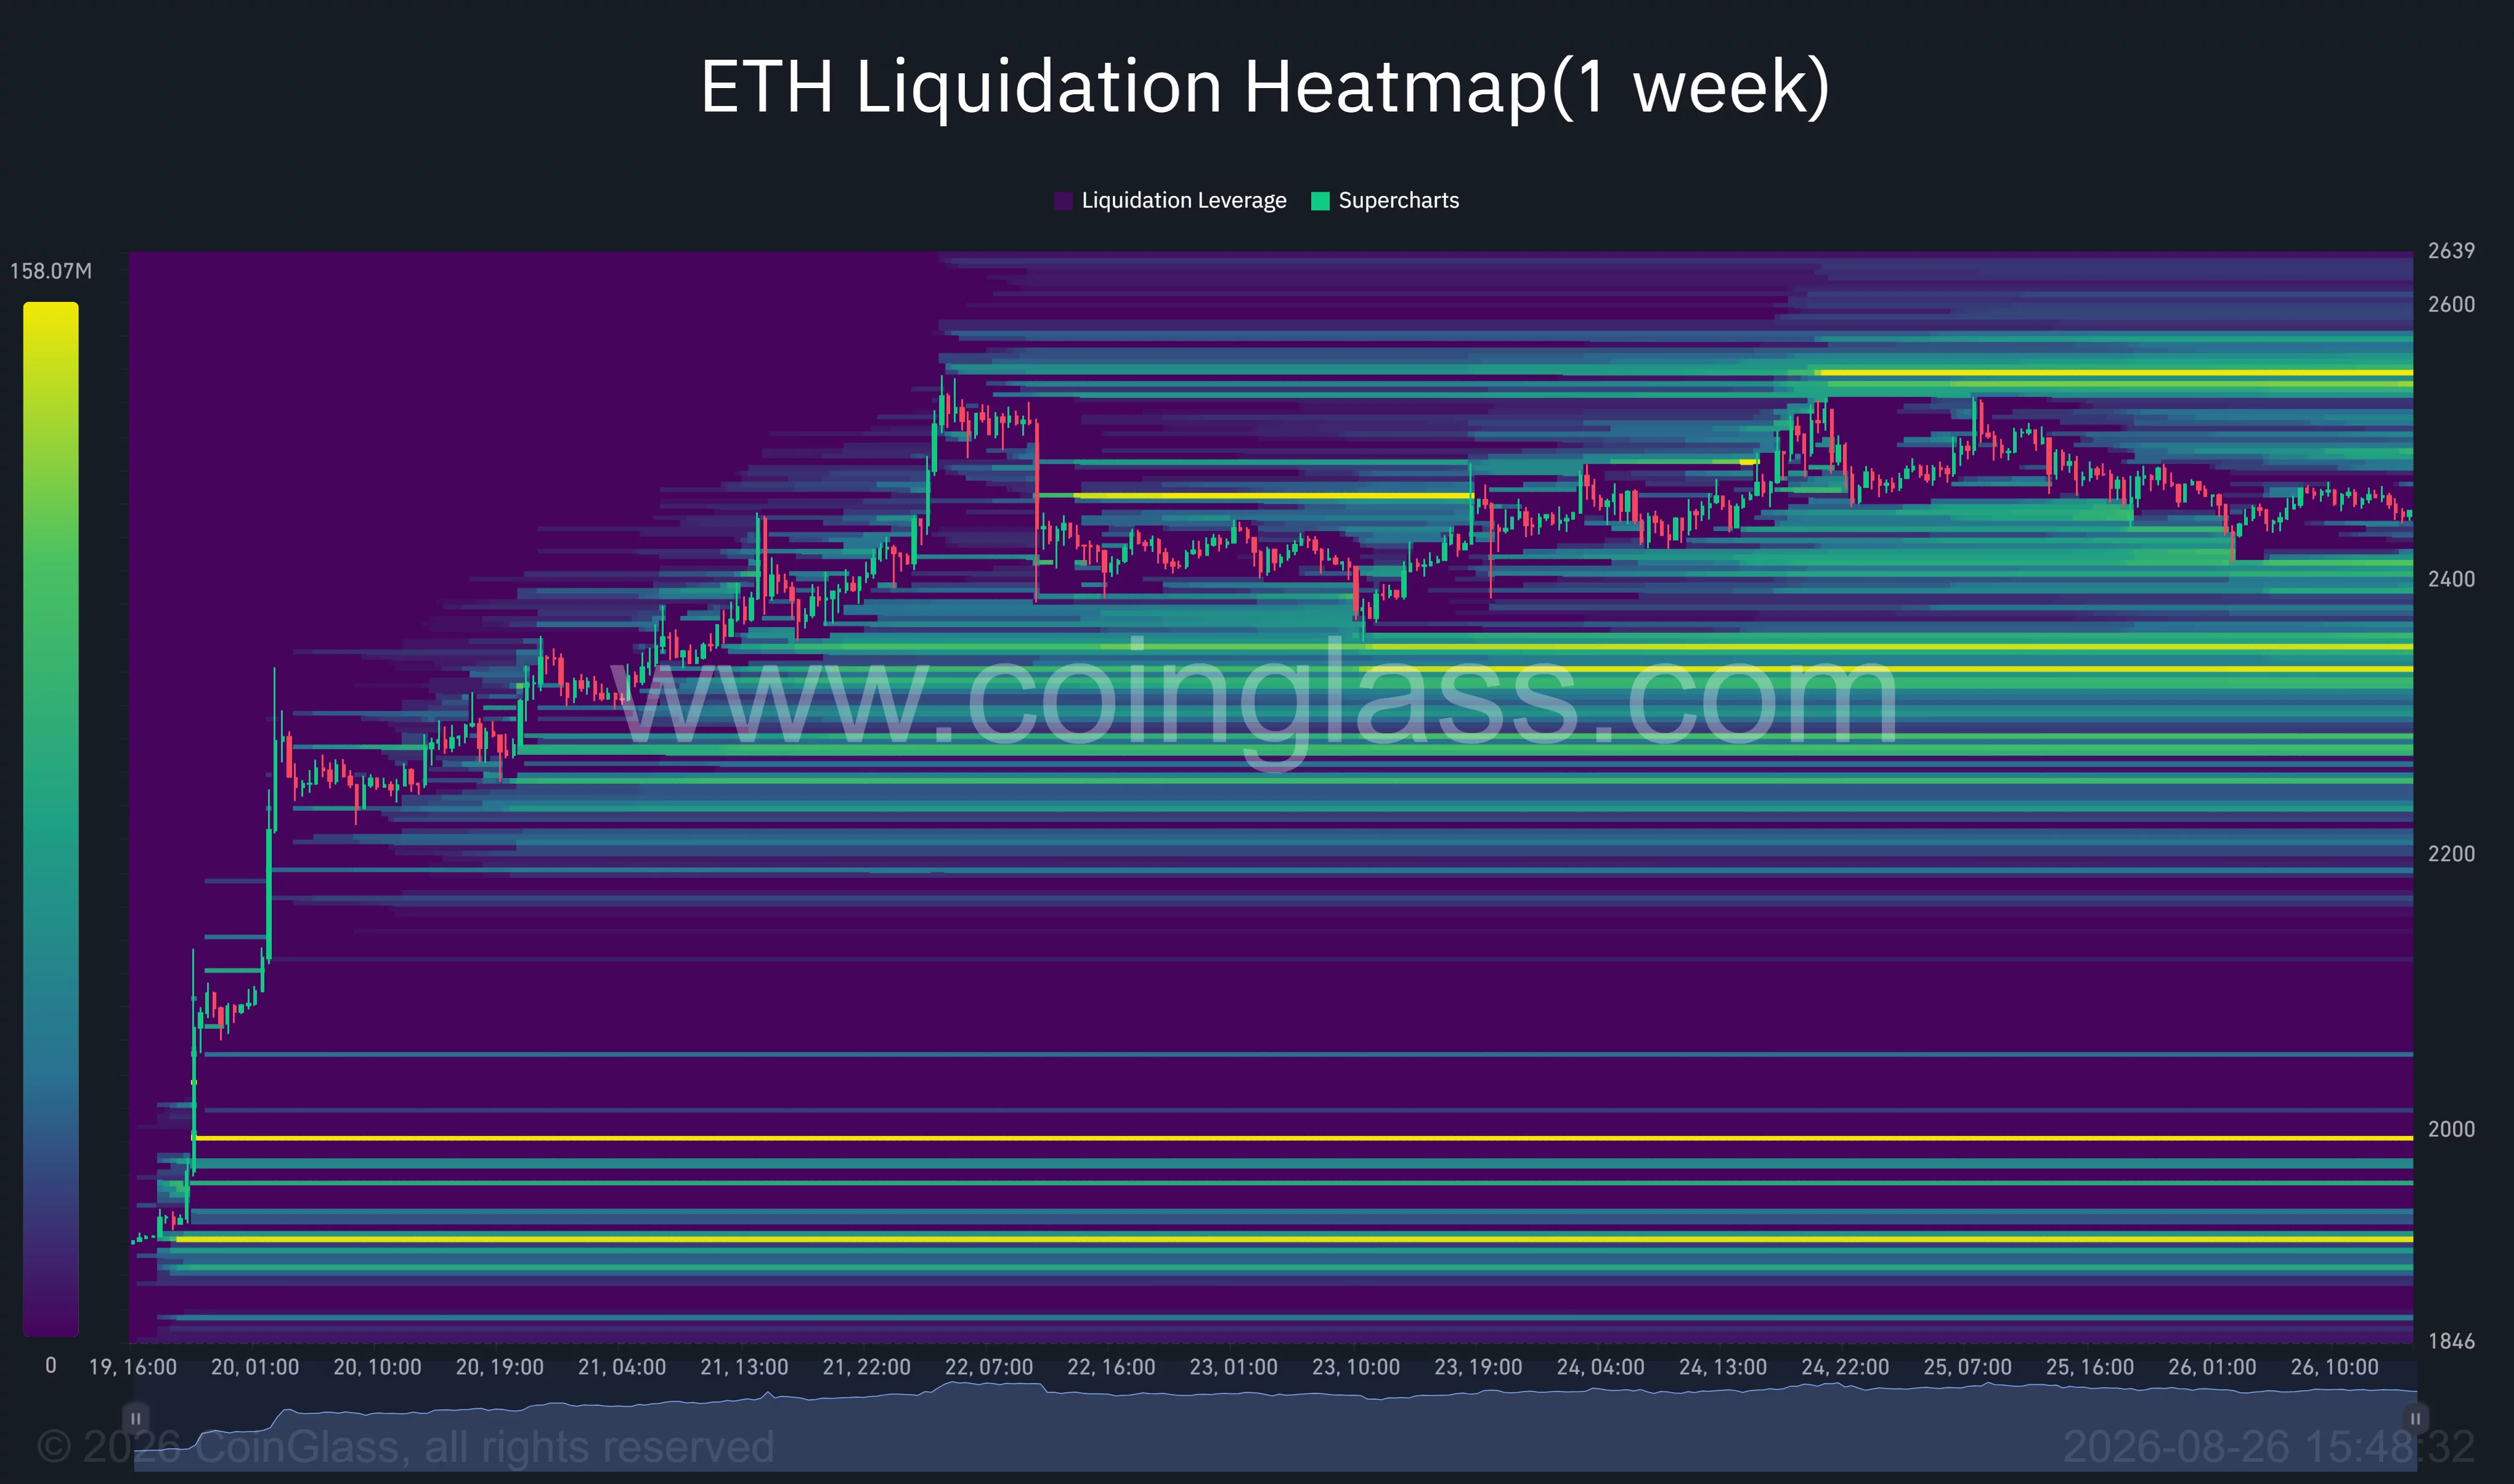
The nearest major pool above Ethereum appears to be around $2,530 to $2,560. A move into that zone could force leveraged short positions to close, potentially adding buying pressure as ETH retests its weekly high.
The heatmap’s brightest band above the market sits close to $2,550, aligning with the technical resistance identified on the price charts. That overlap makes the level important for both spot and derivatives traders.
A larger downside liquidity cluster is visible around $2,300 to $2,330. If Ethereum loses $2,400 and the lower edge of its flag, price could move toward that area as long positions face liquidation pressure.
Additional liquidity is distributed near $2,200, while larger but more distant clusters appear around $2,000 and $1,900. Those lower levels would become relevant only if ETH loses its newly established daily trend support.
Analyst Michaël van de Poppe said on Aug. 26 that an attractive area to buy an Ethereum dip could be approaching. His chart placed the potential demand region below the current price, broadly matching the support visible between approximately $2,300 and $2,400.
Ethereum therefore faces two clear short-term scenarios. A close above $2,550 would confirm renewed strength and could support an expansion toward higher resistance, while a loss of $2,330 would invalidate the 4-hour bull flag and expose the Supertrend support near $2,158.
Until either boundary breaks, ETH is likely to remain in consolidation as traders decide whether the seven-day rally has enough demand for another leg higher.
Disclosure: This article does not represent investment advice. The content and materials featured on this page are for educational purposes only.



Be the first to comment