


What to know:
- FET is testing key support, with a potential rebound toward the $0.25 resistance level.
- RSI recovered from oversold conditions and crossed its signal line, showing improving bullish momentum.
- MACD shows a bullish crossover with expanding green histogram bars, suggesting buyers are gaining control.

Artificial Superintelligence Alliance (FET) price is testing a crucial support area, with a potential rebound targeting key resistance. Technical indicators suggest improving bullish momentum, while rising open interest and stronger trading activity reflect growing market participation. A successful breakout could support further gains.
At the time of writing, FET is trading at $0.2114 with a 24-hour trading volume of $139.11 million and a market capitalization of $477.44 million. After the 2.82% gain over the last 24 hours, the FET price structure and improving technicals point to a bullish reversal ahead.


Source: CoinMarketCap

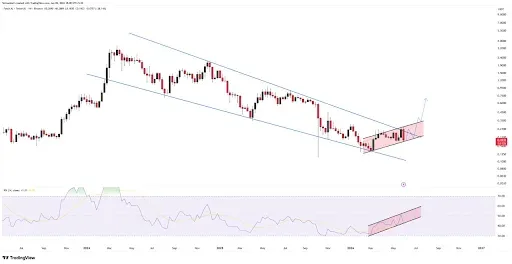
FET Price Eyes Crucial $0.25 Resistance Test
Furthermore, the crypto analyst Team LAMBO highlighted that the FET price is close to a crucial technical level as the token price approaches the lower end of the weekly range. This will provide a strong floor to fuel a positive move as long as the bulls gain the upper hand to help test the resistance levels.

Source: Team LAMBO’s X Post
$0.25 continues to be the critical price level for further monitoring because FET was not able to build momentum in its rising phase from this level. Breaking above it can lead to bullish momentum. But failure to do so will give rise to a breakout reversal pattern, which is a bearish signal.
Also Read: FET Price Prediction: Bullish Breakout Signals Massive Rally Toward $1
Momentum Indicators Point to Improving Outlook
According to TradingView, the RSI (14) index remains neutral at 48.60, while the yellow signal line trails at a level of 42.94. The indicator dropped towards the oversold 30 area before rallying above the signal line after bouncing off from its lows on June 5th. This reflects renewed bullish pressure, but remaining below the 50 level makes sellers significant players.
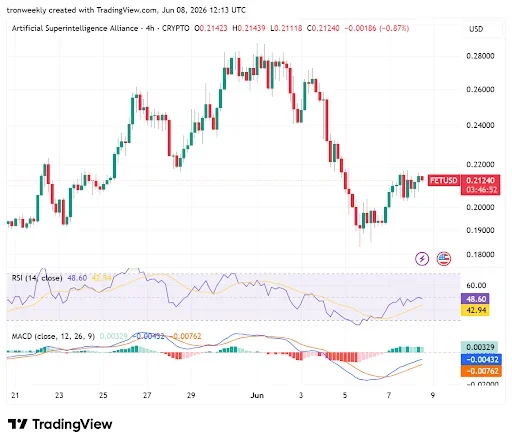

Source: TradingView
The MACD suggests that the trend is reversing itself earlier because the blue line crosses over the orange line upwards from well below zero. The bulls are justified in taking control of things since their crossover is accompanied by the histogram turning from narrowing red bars to widening green bars at 0.00329.
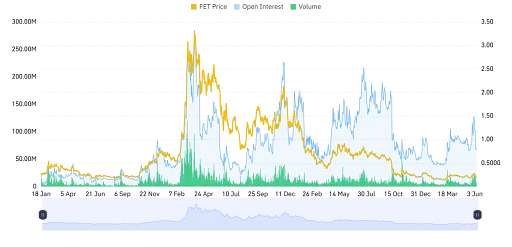
FET Derivative Data Points to Increasing Momentum
However, there is an increase in the open interest of the FET contract by 1.77%, with the total amount standing at $70.58 million. This is a sign that more people have been entering into the market through these derivative contracts as well.

Source: Coinglass
The volume saw an increase of 47.51% to hit $127.08 million. This dramatic rise in volume shows that there is increased trading and liquidity, which implies greater participation from traders as they buy positions.
This article contains market analysis and price predictions. These are not guarantees. Crypto markets are volatile. Always DYOR. Not financial advice.
Also Read: FET Price Action Signals Possible Shift Toward $1 Long-Term Target

Be the first to comment