



What to know:
- FLOKI price rises 3.1% weekly as buyers target a confirmed breakout above $0.0000211.
- An inverse head-and-shoulders pattern points to next targets near $0.0000214–$0.0000215.
- Bearish EMA alignment pressures FLOKI despite signs of improving short-term momentum.
The FLOKI price drew fresh market attention on Saturday, August 8, 2026, where buyers were looking for a bullish reversal. The inverse head and shoulders pattern pointed at improving momentum, but technical indicators showed persistent bearish pressure.
At the time of writing, FLOKI is trading at $0.00002097, showing a decline of 1.21% in the past day. The 24-hour trading volume stands at $14.53 million, with a market capitalization of $200.87 million. Over the last week, the FLOKI price has increased by 3.1%, according to CoinMarketCap.
Also Read: ASTER Price Holds $0.60 as Bullish Outlook Points to Major Long-Term Gains

FLOKI Price Forecast Targets $0.00002203
According to CoinCodex, the FLOKI price is projected to trade between $0.00002106 and $0.00002203 next week. The lower target indicates where the token could trade if market momentum weakens. Meanwhile, the upper target reflects its potential gains during the forecast period.
The price forecast shows a strengthening momentum for the FLOKI token. CoinCodex estimates that the token can register a gain of 4.60% in case it reaches the upper target of $0.00002203. If the forecast proves accurate, this will increase investor confidence and attract more market attention.
Inverse Head-and-Shoulders Puts $0.0000215 in Focus
Analyst Crypto With Gopal identified that FLOKI forms an inverse head and shoulders pattern on its five-minute chart. The formation followed a brief price correction. The right shoulder pattern being relatively higher indicates that buyers are regaining control.
The pattern neckline is placed at $0.0000211. If there is a breakout above this resistance, along with high volume, then the target for this move is likely to be within the range of $0.0000214-$0.0000215.
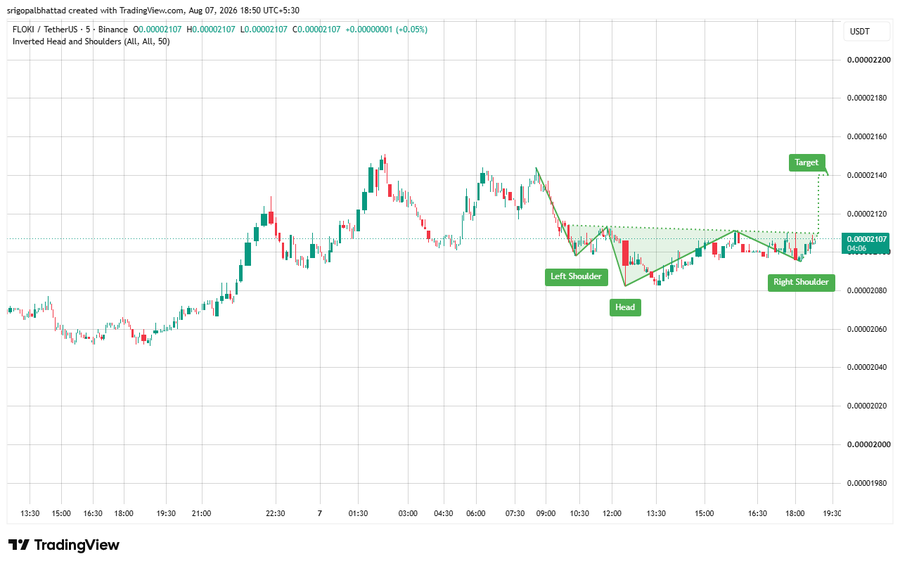
The right shoulder support is still around $0.0000209. If this level holds, the reversal pattern will remain intact. However, a breakdown below it could weaken the setup and delay further gains.
How EMAs Define FLOKI’s Bearish Outlook
According to TradingView, the 20-day EMA for FLOKI is at $0.00002107, whereas the 50-day EMA is at $0.00002243.
The 20-day EMA is trading below the 50-day EMA level, indicating a bearish trend for the short term. A crossover above the 50-day EMA may point toward a strengthening market.
For the 100-day EMA, it is at $0.00002501, while the 200-day EMA is currently at $0.00003210. The 100-day EMA is trading below the 200-day EMA level, which is pointing toward a bearish trend.
The Bollinger Band (BB) indicator for FLOKI shows an upper band at $0.00002212, a middle band at $0.00002098, and a lower band at $0.00001984. These levels define FLOKI’s immediate volatility range.
Why FLOKI Needs a $0.0000211 Breakout
For now, the FLOKI price remains caught between an intraday bullish reversal pattern and bearish daily indicators.
Buyers need a clear breakout of the neckline before the reversal case gains stronger technical support. Until then, the resistance of $0.0000211 and the support of $0.0000209 will likely guide the token’s next move.
Also Read: Bitcoin Price Breakout Targets $125K as Whale Accumulation Accelerates
This article contains market analysis and price predictions. These are not guarantees. Crypto markets are volatile. Always DYOR. Not financial advice.



Be the first to comment