



Similar spikes in Bitcoin’s realized losses preceded local price bottoms in August and September, raising the possibility that the $80,000 region could provide near-term support for BTC.
However, the Bitcoin price outlook remains uncertain. Technical resistance near $83,000, continued spot Bitcoin ETF outflows, and concentrated liquidation levels around $80,600 and $82,300 suggest that BTC could face further volatility before establishing a clearer direction.
Glassnode Identifies Signs of Seller Capitulation
Glassnode reported another episode of Bitcoin seller capitulation on October 15, 2026, as BTC traded near the $80,000 region. Capitulation occurs when investors sell their holdings at a loss, often during periods of heightened uncertainty or declining prices.
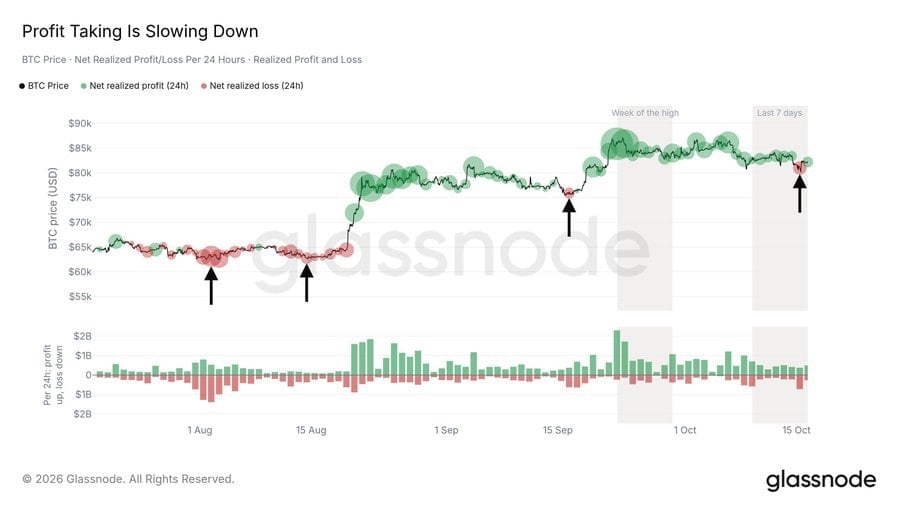

Glassnode reports renewed Bitcoin seller capitulation on October 15, with realized loss spikes coinciding with local price bottoms in August and September 2026. Source: Glassnode via X
In its October 16 report, Glassnode noted that previous bursts of realized losses in early August, mid-August, and September coincided with local market bottoms. The latest episode follows a similar pattern, although the historical relationship does not guarantee another recovery.
Realized losses measure the value investors give up when they sell Bitcoin below the price at which they acquired it. A sharp increase in this metric can indicate that holders are exiting positions under pressure rather than waiting for a rebound.
Glassnode’s latest analysis also points to a decline in loss-taking among long-term holders. In its October 14 report, Boxed In, the analytics firm said long-term holder realized losses had fallen approximately 85% from their August 12 peak. The report also noted that holders realizing profits were increasingly outweighing those selling at a loss.
These developments provide a potentially constructive signal for the BTC price. When forced or emotionally driven selling subsides, the market may require less immediate buying demand to stabilize. Nevertheless, capitulation alone cannot confirm that a durable bottom has formed.
Bitcoin Price Prediction: $80K Support Faces a Critical Test
Bitcoin was trading around $82,000–$83,000 in the October 15–16 reporting period after briefly falling below $80,000 earlier in the month. The recovery places BTC above the psychologically important $80,000 level, but the market still needs to overcome nearby resistance.
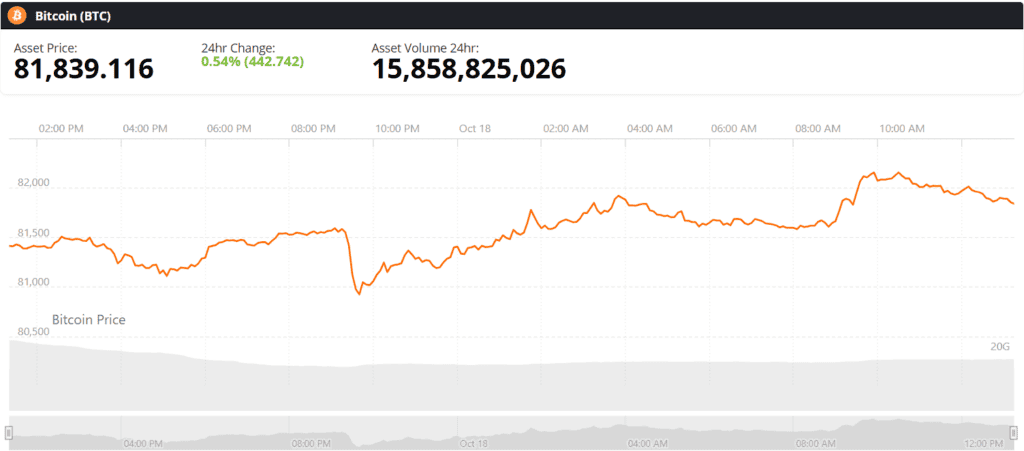
Bitcoin (BTC) price chart. Source: Brave New Coin
Glassnode identified the U.S. spot Bitcoin ETF cost basis near $81,500 as an important support reference. This represents the average acquisition price of Bitcoin held by U.S. spot ETFs. According to the firm’s October 14 analysis, BTC dipped below this level on October 8 and October 13 but closed both sessions above it.
The firm warned that a daily close below the ETF cost basis could weaken the nearest on-chain support. Its report also identified substantial bids around $80,000 on Binance, creating another level to watch if selling pressure returns.
Meanwhile, a separate technical analysis published on TradingView by Virupandey81 identifies $79,821 as a key downside threshold. The chart places the initial positional-long reference at $81,263 and calls for confirmation before adding exposure above $83,014.
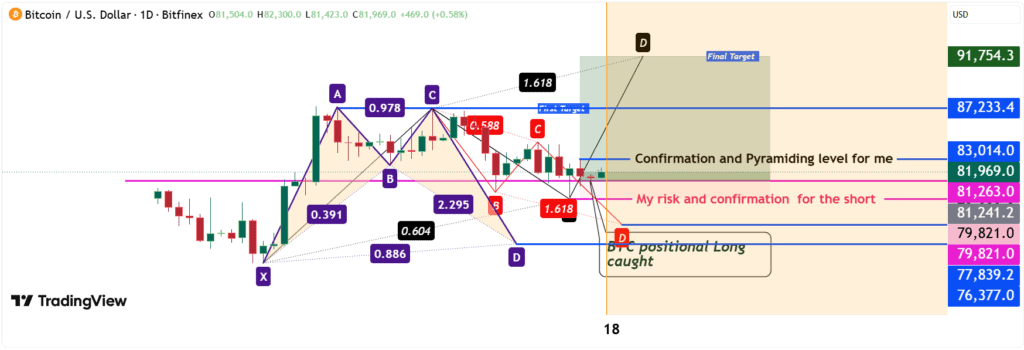
Bitcoin climbed from around $75,000 to $87,000 before correcting, recovering toward its previous high, and declining again, forming overlapping harmonic patterns. Source: Virupandey81 on TradingView
If Bitcoin holds above support and clears the $83,014 confirmation level, the chart identifies $87,233 as the first upside objective, followed by a projected extension near $91,754. These are technical targets rather than confirmed forecasts, and reaching them would require BTC to overcome intervening resistance.
A sustained move below $79,821 would weaken that bullish setup. The same chart identifies lower projected levels near $77,839 and $76,377, which could become relevant if the breakdown continues. Neither level guarantees a reversal.
The distinction is important for any Bitcoin price prediction: a potential support zone becomes more convincing when price repeatedly holds above it, while a decisive breakdown can invalidate an otherwise constructive setup.
Bitcoin Liquidation Heatmap Highlights $82.3K and $80.6K
Bitcoin’s derivatives market provides another indication of where short-term volatility could develop. CoinGlass shared a 48-hour liquidation heatmap showing concentrated leveraged positions around $82,300 and $80,600.
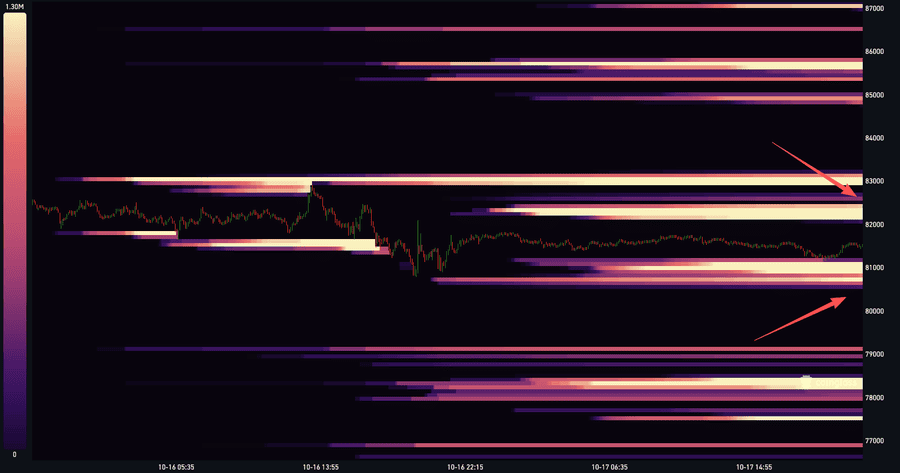
Bitcoin’s 48-hour liquidation heatmap shows concentrated high-leverage liquidation clusters around $82,300 and $80,600. Source: CoinGlass via X
The upper zone near $82,300 represents a nearby cluster of potential liquidations, while the lower region around $80,600 contains another concentration of leveraged exposure. As BTC approaches these levels, forced position closures could amplify price movements.
Liquidation heatmaps estimate where leveraged positions may be vulnerable to forced closure. They do not show guaranteed buying or selling orders, and the displayed clusters can change as traders adjust their positions.
A move above $82,300 could trigger liquidations among traders positioned for further declines, potentially adding momentum to an upward move. Conversely, a drop toward $80,600 could put leveraged long positions under pressure, increasing the risk of a faster decline.
These levels also sit close to the broader support region highlighted by Glassnode. Their proximity makes the $80,000–$82,300 range particularly relevant to the near-term Bitcoin price forecast.
However, liquidation activity should be assessed alongside spot-market demand, trading volume and ETF flows. A temporary price spike caused by forced closures does not necessarily establish a lasting trend.
Bitcoin ETF Outflows Add Pressure to the Price Outlook
Despite the potential support signals from on-chain data, institutional investment flows remain a concern. U.S. spot Bitcoin ETFs recorded approximately $228.6 million in net outflows during the five trading sessions ending October 16, according to reported fund-flow data. Month-to-date net outflows reached roughly $615 million to $618 million.

BlackRock reportedly sold $570 million in Bitcoin as bearish forecasts warned of a potential drop to $75,000 after a brief rebound. Source: @Danny_Crypton via X
BlackRock’s iShares Bitcoin Trust (IBIT) accounted for approximately $165 million in weekly outflows, including about $71.8 million on October 16. Fidelity’s Wise Origin Bitcoin Fund also recorded outflows during the period.
These figures indicate that investors withdrew more money from the funds than they added during the measured period. However, they do not establish that BlackRock independently sold $570 million in Bitcoin on the open market, as claimed in a post by @Danny_Crypton on X.
ETF outflows reflect net investor redemptions and fund activity; they should not automatically be interpreted as evidence that an asset manager is deliberately pushing Bitcoin prices lower. The distinction matters when evaluating claims about institutional selling and the risk of a Bitcoin crash.
Continued redemptions could still weaken a source of market demand, particularly if they coincide with broader risk aversion. Glassnode’s October 14 report similarly noted that spot Bitcoin ETFs had returned to net selling after inflows in late September failed to persist.
The combination of ETF outflows and declining realized losses presents a mixed picture. Selling pressure among existing holders may be easing, but fresh investment demand has not yet provided a clear signal of sustained recovery.
What Comes Next for Bitcoin Price?
Bitcoin’s next move will likely depend on whether buyers can defend the $80,000 region while absorbing selling pressure and overcoming nearby resistance.
The bullish scenario gains support if BTC maintains the area around the $81,500 ETF cost basis, holds above the $80,000–$80,600 support zone, and moves through $83,014. Under the TradingView chart’s projections, $87,233 would be the first upside target, with $91,754 representing a more distant objective.
The bearish scenario becomes more relevant if Bitcoin loses the $79,821 technical threshold and fails to recover it. In that case, the projected levels around $77,839 and $76,377 would become areas to monitor, while liquidation activity could accelerate the decline.
Glassnode’s capitulation data offers evidence that some selling pressure may be reaching an extreme, but it is only one part of the market picture. ETF flows, liquidity conditions, spot demand, and price behavior around support will help determine whether the latest loss-selling episode marks a local floor or merely another pause in Bitcoin’s decline.
For now, the $80,000 region remains a key reference point in the Bitcoin price prediction. A sustained recovery would strengthen the case for higher targets, while a decisive breakdown would challenge the emerging stabilization signal.


Be the first to comment