



The price of Hedera (HBAR) is returning to $0.08275, a major technical support level, amid bearish pressure.
The monthly chart of the instrument has a long-term pattern of a triangle, which may form the next significant price action. On the 4-hour time frame, HBAR has broken above its October highs, signaling a momentum decline.
The major issue is whether buyers can justify the existing support level and hold the market. If the sustained recovery continues, the resistance could be seen in the descent, and if the breakdown occurs, the lower levels near $0.071 could be seen.
HBAR Faces Selling Pressure Below $0.092
According to BraveNewCoin market data, HBAR is currently trading at $0.08275, falling by 2.61% in the last 24 hours. The token’s price range in the past 24 hours is 0.08207-0.08710. The value of its market capitalization is $3.64 billion, and the trading volume is $104.75 million.

On the other hand, the 4-hour chart for HBAR indicates that the token is currently trading at $0.08234 on October 17, 2026. The price is out of the trendline chart and sitting near $0.09212. with a falling trendline. This is now the level that is an upper limit for recovery, but buyers need to muster a powerful response to test it.
Four-Hour Chart Signals Further Downside Risk
On the 4-hour chart, HBAR is consolidating its gains and heading back to the $0.12 level from its highs seen in late September. The ongoing sell-off has driven the token near the bottom of its Bollinger Bands. The bottom of its lower band is at $0.07103, and the top of its upper band is at $0.11322.
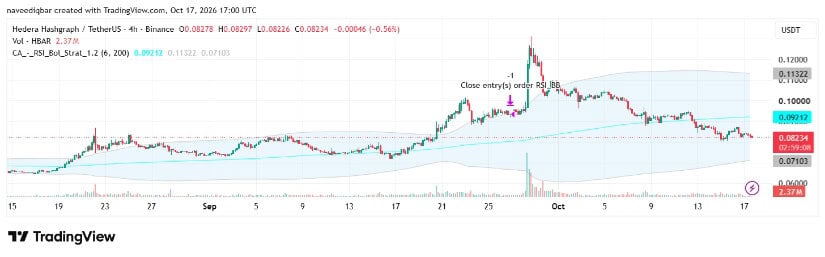 HBAR is trading at $0.09212, which is close to the middle line of the chart’s trend indicator. Source: TradingView
This formation indicates that the sellers are still holding the upper hand in the recent price trend. But a turn up from below $0.09212 would be better for the near term and could create resistance at $0.10.
Monthly Triangle Keeps the $0.57 Level in Focus
HBAR continues to trade inside of a long-term triangle pattern, as seen on the monthly chart shared on X. Both rising support and descending resistance continue to the lows from 2020 and 2021 highs, respectively. The price has been compressed between these two trending lines over the past few years, hence the pattern.
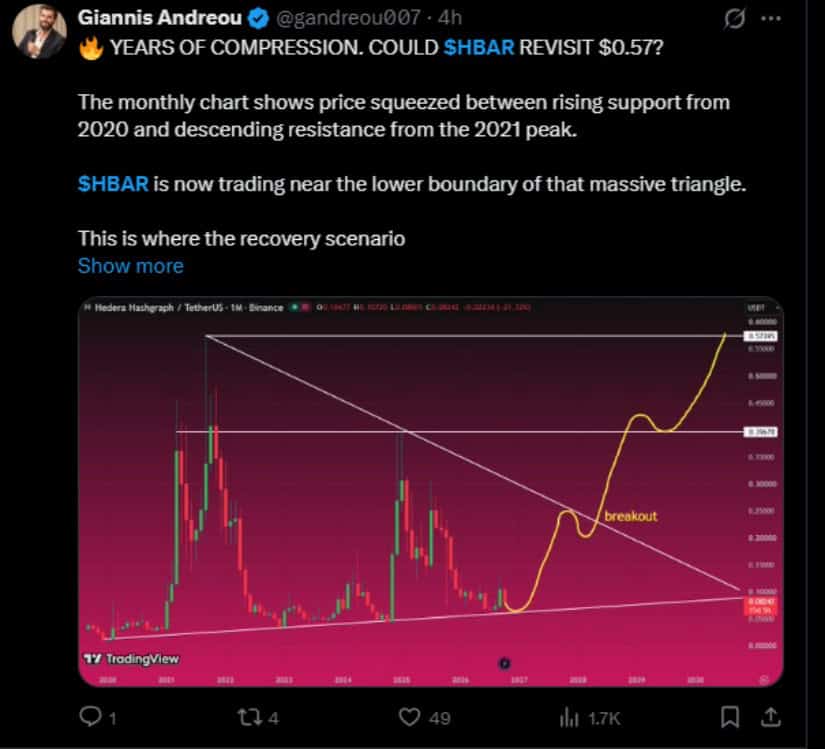 The chart below shows a possible scenario for a breakout where HBAR may move back toward $0.57 in the future. Source: Giannis Via X
This level corresponds to the peak from the provided market data that occurred in the past. However, this is a conditional projection, and the price hasn’t confirmed a breakout above the descending resistance.
Support and Resistance Levels to Watch
The immediate support level is around $0.0820, the daily low for HBAR. If the price stays below this level for an extended period, it may reach the lower Bollinger Band around $0.07103. Traders can also watch to see whether buyers support the wider uptrend on the monthly chart.
The good news is that HBAR will need to rally to $0.09212 to threaten its downtrending near-term condition. Further resistance could emerge around $0.10 and the recent peak above $0.12. A close-out above the monthly triangle’s resistance would support the big-time recovery outlook.


Be the first to comment