



Ethereum trades near $1,805 on July 11, pushing above the falling 50-day moving average and probably going for a retest attempt.
The rebound from the $1,505 June low has now returned Ethereum to the exact zone where its last weeks of trouble began. Price is working through a confluence at $1,805: the horizontal shelf that rejected the late-June recovery attempt and the descending 50-day SMA have converged into almost a single band. Holding above it after the initial push would be the first successful retest of the 50-day since the average turned lower in May.
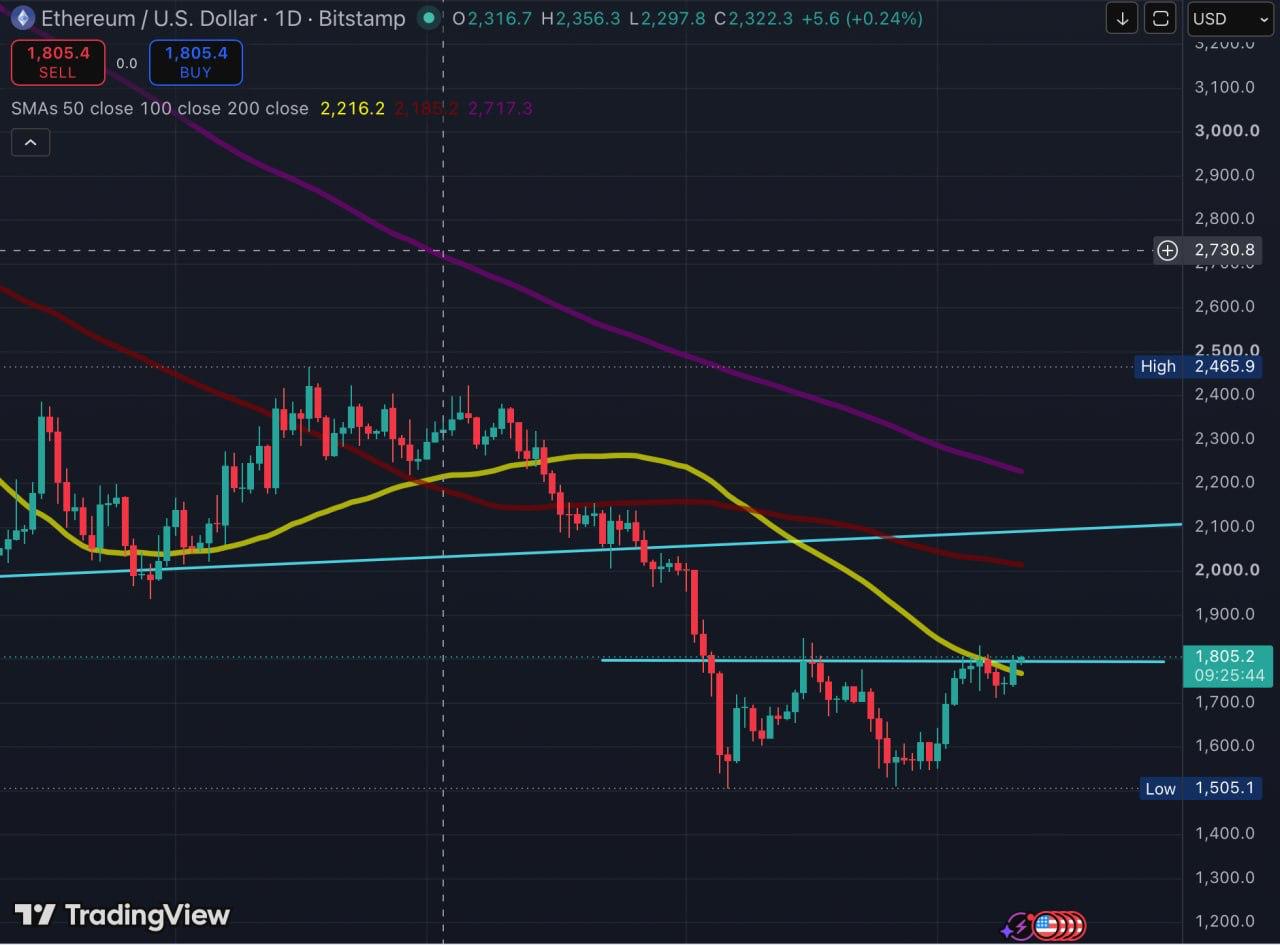
Clearing the band probably would shift the target to the 0.382 Fibonacci retracement of the decline, around $1,870. Above that, the chart is thin until the 100-day average and the $2,000 area where a rising trendline was lost. Failure at the current confluence, by contrast, leaves the sequence of lower highs intact and puts the $1,700 area back in play as the first support, with the $1,505 low as the structural floor.
A Tenfold Bridge Spike Adds a Demand Angle
The flow data supplies the fundamental story the chart lacks. ETH bridged from Ethereum mainnet to Robinhood Chain increased roughly 10x over the past week, crossing $100 million in cumulative deposits, according to Token Terminal data. The chain, Robinhood’s layer-2 network built for its tokenized equities push, uses ETH as its native gas token, which means every account funded and every transaction executed on it consumes ETH-denominated resources.
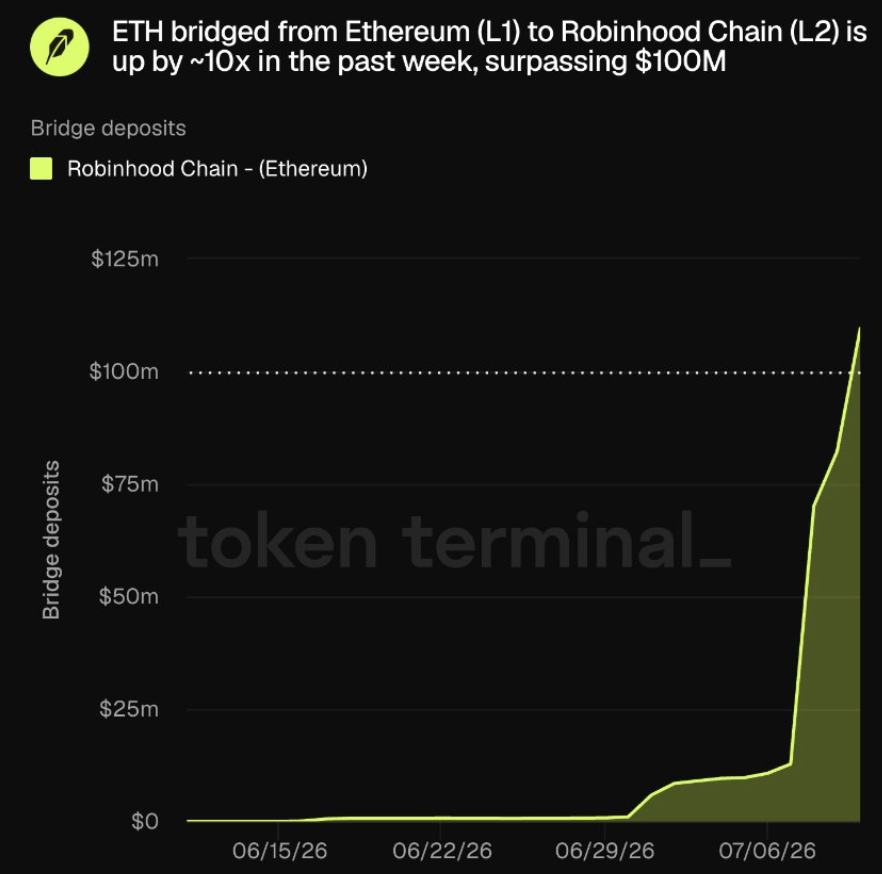
The number is small against Ethereum’s market capitalization which is around $219B per CoinMarketCap, and one week of bridge flows does not establish a trend. What makes it worth tracking is the mechanism: unlike exchange inflows, which typically precede selling, bridge deposits to an ETH-gas network represent ETH being put to work rather than put up for sale. If Robinhood’s tokenized stock volumes keep scaling, the bridge becomes a recurring bid for ETH from a brokerage user base that mostly did not hold it before, a demand source independent of crypto-native sentiment.
Confirmation for the bullish read is specific: a daily close above the 50-day band, a hold on the retest, and continued weekly growth in Robinhood Chain deposits. Rejection at $1,805 paired with a flattening of the bridge curve would mean both the technical and the flow argument failed at the same time, and the range floor becomes the operative level again.
The information provided in this article is for informational purposes only and does not constitute financial, investment, or legal advice.

Alex is Editor-in-Chief of Coindoo and co-founder of Millennial Media Group, with nearly a decade of experience covering financial markets – crypto first, then everything else.
It started in 2016 with Bitcoin. Like most people at the time, he didn’t fully understand it – so he kept digging. Blockchain, tokenomics, the projects, the cycles. That curiosity never stopped, and eventually pulled him into traditional markets too: equities, commodities, macro. Not because he left crypto behind, but because you can’t properly understand one without the other.
What drives him is straightforward: he wants to know why something is happening, not just that it’s happening. Most market coverage stops at the headline – price up, price down, here’s a chart. Alex finds that kind of reporting actively unhelpful. If you walk away from an article without understanding the mechanism behind the move, what did you actually learn?
He holds a degree in Tourism from New Bulgarian University – not the most obvious path into financial markets, but markets have a way of pulling in people who are simply too curious to stay out. He has authored over 200 in-depth analyses and more than 10,000 articles across crypto and traditional finance. He still thinks every day in markets teaches him something new. That’s probably why he hasn’t stopped.



Be the first to comment