


Hyperliquid has fallen sharply from its record high after a whale-led selloff triggered a wave of liquidations and pushed momentum indicators into their weakest position since the token’s breakout rally began.
Summary
- Hyperliquid fell from a record high of $75.48 to near $62 after Arthur Hayes sold his entire $18 million HYPE position, triggering a wave of profit-taking and liquidations.
- HYPE’s daily MACD has printed its first bearish crossover since May, while key support levels at $55 and $50 have come into focus if selling pressure continues.
- Despite the selloff, a16z-linked wallets accumulated more than $15 million worth of HYPE, lifting their 2026 holdings to roughly 6.9 million tokens.
According to data from crypto.news, Hyperliquid (HYPE) price was trading near $62 on Friday, June 5, after plunging from an all-time high of $75.48 just a day earlier. The token briefly touched the $58 area before buyers stepped in, though sentiment remains fragile following the abrupt exit of several prominent market participants.

The immediate bearish catalyst came from BitMEX co-founder Arthur Hayes, who liquidated his entire HYPE position worth roughly $18 million, as reported by crypto.news on June 4.
On-chain data tracked by Onchain Lens showed Hayes sold approximately 247,334 HYPE tokens. Other prominent traders, including Andrew Kang and Andreas Brekken, were also linked to sizable reductions in exposure. The concentrated selling overwhelmed spot demand and triggered a decline that wiped more than 17% off HYPE’s value within hours.
The selloff came only months after Hayes publicly projected a $150 price target for HYPE and placed a $100,000 charity wager on the token outperforming other large-cap cryptocurrencies.
Following the exit, Hayes pointed to a combination of macroeconomic headwinds, including rising oil prices driven by Middle East tensions, liquidity demand from several major AI-related IPOs, and the risk of a broader downturn in financial markets later this year.
Despite closing his position, Hayes maintained a bullish long-term outlook for HYPE. In a June X post, he wrote:
“Btw just because I dumped my entire $HYPE bag, doesn’t mean I still don’t have faith $HYPE will best $SOL by year end. Sometimes you gotta go down to go up.”
Additional pressure emerged from derivatives markets. Lookonchain reported that loracle.hl, a whale trader who previously lost $46.46 million shorting HYPE, had flipped long and was facing another unrealized loss of more than $840,000 during the latest selloff. The trade underscored how quickly leverage has been punished on both sides of the market as volatility intensified.
Technical structure places $55 and $50 in focus
The daily chart shows that HYPE has retreated into a key Fibonacci support region after failing to hold above the recent breakout zone. The token is currently trading between the 0.786 retracement level near $63.9 and the 0.618 level near $54.6, measured from the January low around $20.4 to the June peak near $75.7.
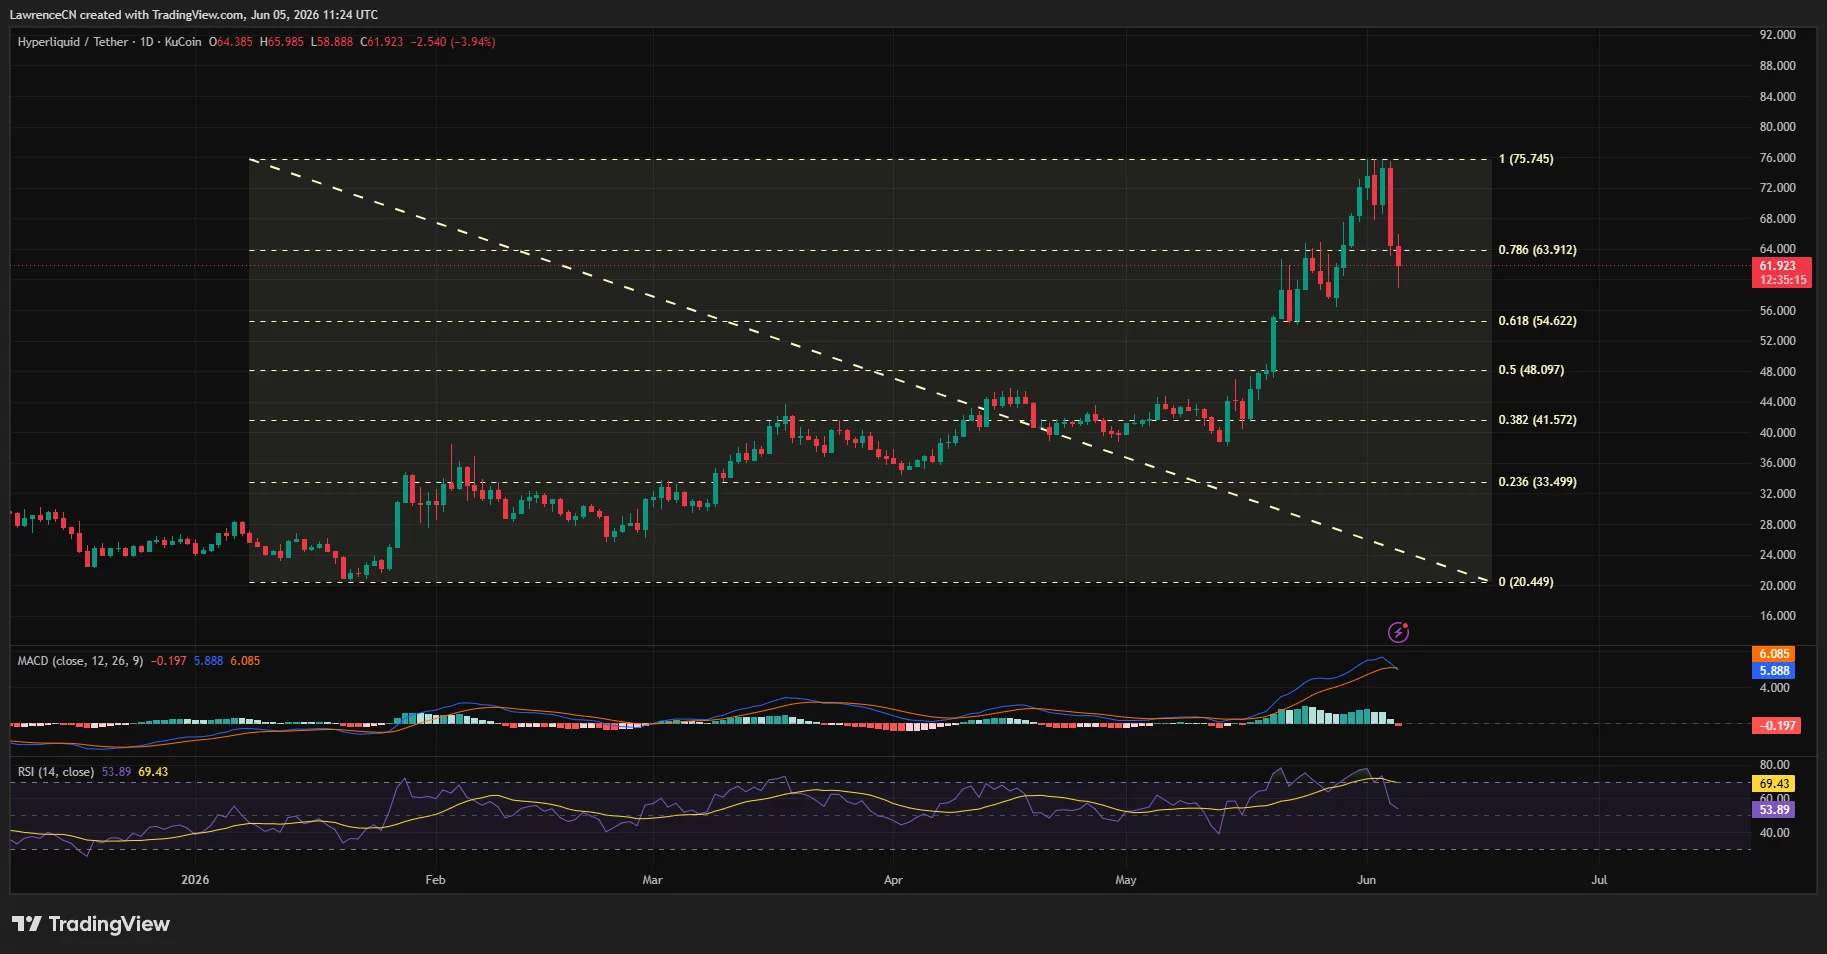
A breakdown below the 0.618 retracement could expose the midpoint support near $48.1, bringing the psychologically important $50 level into view. The area between $54 and $55 now represents the first major support cluster bulls need to defend.
Momentum indicators have also deteriorated. The daily MACD has produced its first bearish crossover since the rally accelerated in May, while the histogram has turned negative.
At the same time, the Relative Strength Index has dropped from overbought territory above 70 to roughly 54, showing that buyers have lost control of short-term momentum.
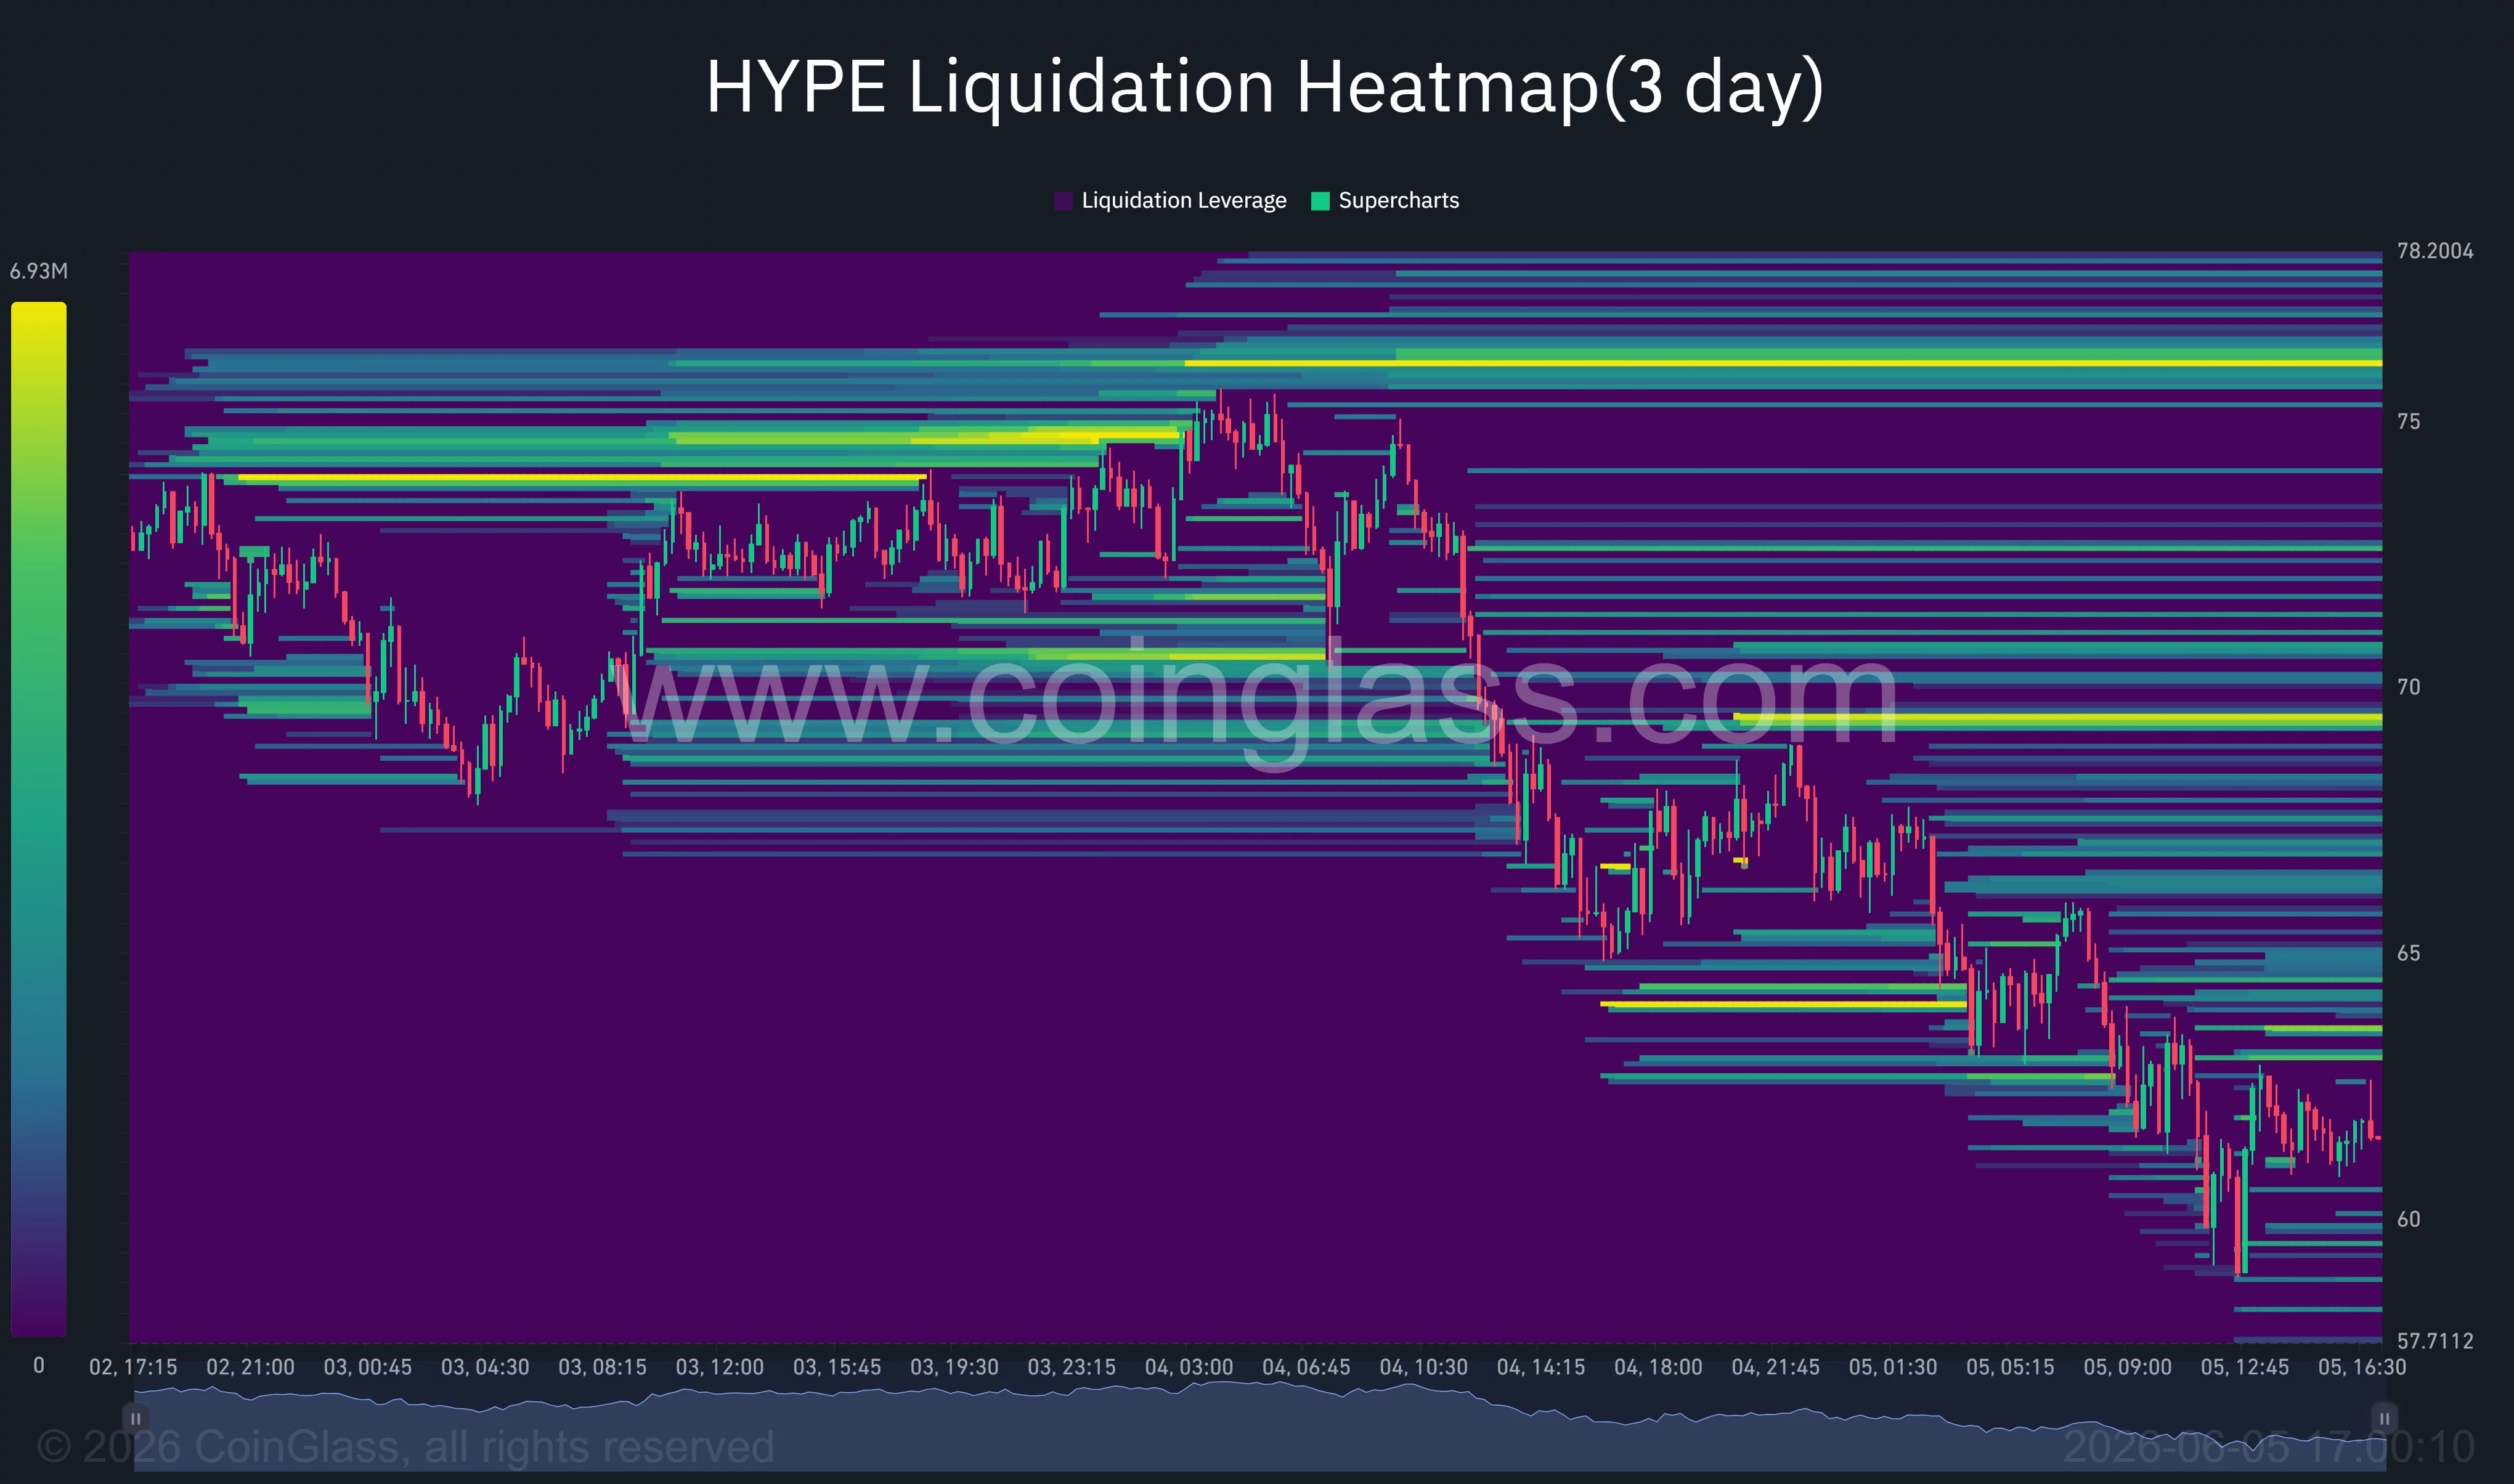
CoinGlass liquidation heatmaps identify another critical zone. Dense concentrations of leveraged positions remain stacked between $60 and $64, while larger liquidity pools sit around $58 and below. A decisive move through those levels could trigger another round of forced selling and increase downside volatility.
Institutional accumulation continues beneath the selloff
Not all capital has been leaving the ecosystem. As reported by crypto.news earlier, wallets linked to venture capital firm Andreessen Horowitz accumulated an additional 224,100 HYPE tokens worth more than $15 million during the selloff.
The latest purchase increased a16z-linked holdings to roughly 6.90 million HYPE acquired in 2026, representing an estimated position worth more than $322 million. The buying activity contrasts sharply with the profit-taking seen from traders and whales near the highs.
Fundamentals also remain supportive for the token. Hyperliquid continues generating some of the highest revenues in crypto, while approximately 99% of protocol fees are directed toward programmatic HYPE buybacks.
The decentralized exchange has steadily increased its share of perpetual futures trading volume, giving the token a revenue stream that few competitors can match.
However, several risks could still challenge the bullish case. Further weakness in Bitcoin (BTC), escalating geopolitical tensions, additional whale distributions, or a sustained break below the $55 support area could accelerate losses toward $50.
For now, traders appear focused on whether HYPE can reclaim the $64 region and invalidate the bearish MACD crossover before sellers target the next major support zone.
Disclosure: This article does not represent investment advice. The content and materials featured on this page are for educational purposes only.

Be the first to comment