


What to know:
- JASMY forming a falling wedge on the weekly chart suggests weakening bearish pressure and a potential breakout setup.
- Technical projections point to a possible move toward $0.021 if a breakout confirms with strong volume.
- An RSI at 61.51 and a bullish MACD crossover signal are rising buying pressure and improving sentiment.

JasmyCoin (JASMY) is moving in a positive price trajectory despite the cautious optimism in the crypto market. According to CoinMarketCap, the JASMY price has surged by 2.21% over the last 24 hours and 4.49% over the last week.
At the time of writing, the token is trading at $0.006000 with a trading volume of $12.46 million, which has declined by 17.81% over the last 24 hours. However, its market capitalization stands at $296.55 million, which is up by 2.27%.

Source: CoinMarketCap

Also Read: JASMY Price Eyes $0.008 Breakout After Prolonged Triangle Consolidation
JASMY Falling Wedge Setup Hints at Upside Move
Furthermore, the crypto analyst, Clifton Fx, highlighted that the token is showing a developing falling wedge pattern on the weekly timeframe, a structure often associated with weakening bearish momentum.
Price continues to print lower highs and lower lows while volatility contracts, suggesting selling pressure is gradually fading and buyers may be building a potential accumulation zone within the tightening range.

Source: Clifton Fx’s X Post
A clear breakout above the upper trend line, preferably with the support of strong momentum candle formation and increased trading volumes, will confirm the positive bias.
The technical expectation based on the pattern formation is a push towards the $0.021 area. However, caution remains because false breakouts within the wedge formation tend to extend the consolidation period.
Momentum Indicators Point to Increasing Strength
According to TradingView, JASMY is at the heart of a bounce back in the market from an initial year’s jolt. After testing a high of nearly $0.01000, the coin dipped to find support at about $0.00500 during February and March.
Recently, the coin has emerged from its slumber to retest $0.00593. The rising momentum indicates a steady push by bulls.
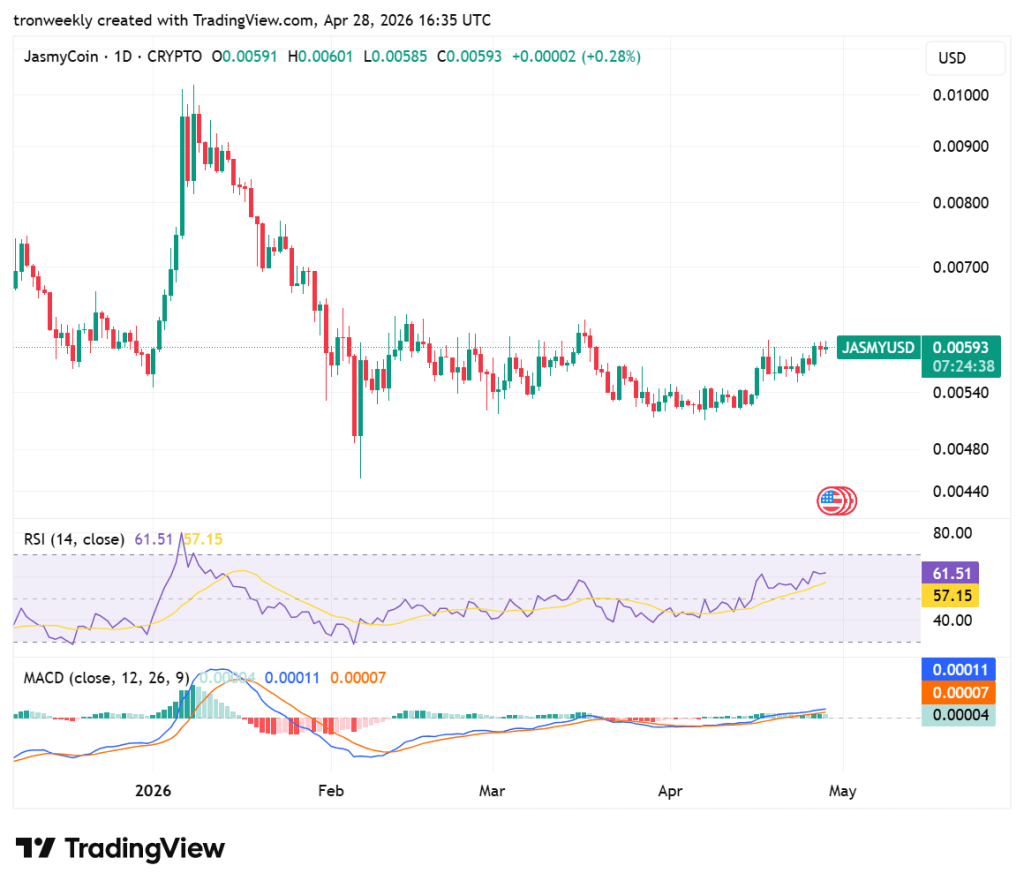
Source: TradingView
Technicals are favoring the bullish bias. The RSI is at 61.51, suggesting stability but not being in an overbought state. Meanwhile, there has been a bullish crossover on the MACD indicator, as the signal lines are rising.
Combining both pieces of evidence suggests better investor sentiment and that JASMY is primed for more upside if buying continues.
This article contains market analysis and price predictions. These are not guarantees. Crypto markets are volatile. Always DYOR. Not financial advice.
Also Read: JasmyCoin (JASMY) Falling Wedge Pattern Builds as Breakout Targets $0.023

Be the first to comment