


What to know:
- Chainlink (LINK) forms a descending wedge, signaling a potential breakout with targets up to a 150% move toward $21.
- RSI at 70.05 signals overbought conditions, suggesting possible short-term consolidation.
- LINK faces resistance at the 200-day EMA near $11.47, which is key for confirming a bullish reversal.

Chainlink price is forming a descending broadening wedge, hinting at a possible bullish breakout above resistance. Indicators show strength as price clears key EMAs and momentum rises, though overbought conditions and resistance may cause short-term consolidation in Chainlink price. While derivative data point to a cautious outlook. According to CoinMarketCap, LINK is trading at $10.40 with a 24-hour gain of 1.12%.

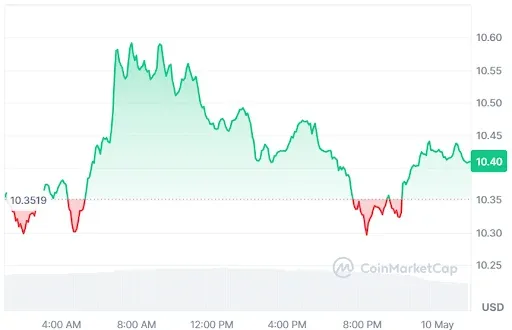
Source: CoinMarketCap
LINK Derivative Data Point to Mixed Outlook
According to Coinglass, the LINK open interest has increased by 1.31%, reaching $498.37 million, indicating rising market participation and stronger positioning among traders.

This suggests a modest buildup in outstanding contracts compared with the previous period, reflecting renewed engagement and slightly improving sentiment across the market.

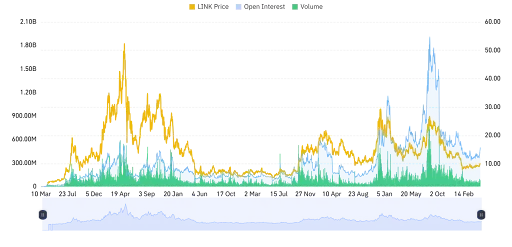
Source: Coinglass
Volume has decreased by 20.83%, standing at $551.43 million, indicating reduced trading activity and lower short-term participation. This decline may suggest weakening momentum in the market compared with earlier levels, reflecting cautious sentiment among traders.
Also Read: Chainlink Price Prediction: LINK Whale Activity Hints at a Reversal Ahead
Chainlink Price Setup Hints at a 150% Breakout Ahead
Furthermore, the crypto analyst Clifton Fx pointed out that LINK has formed an ascending broadening wedge structure on the daily time frame. However, the Chainlink price fluctuations become wider despite the downtrend nature.
Such technical formations often denote weakening sell-offs and a potential shift in the trend. Technical experts are waiting for a breakout above the upper resistance level, preferably on higher volumes and bullish price momentum.


Source: Clifton Fx’s X Post
In case the Chainlink price makes a clear breakout, and with the token exhibiting a momentum candle pattern with an increase in participation, there is the possibility of an upward move.
According to technical analysis, the wedge pattern has the potential of moving to the upside by 100% – 150%. Analysts are looking at the $21 level as a target.
LINK Technical Indicators Reinforce Bullish Phase
According to TradingView, the Chainlink price has recovered from a sharp decline in 2026. The price established a base at $7.60 and traded within a narrow range.
Bullish candles pushed the Chainlink price higher to $10.40, piercing the 20-day, 50-day, and 100-day moving averages. The move represents a structural shift for the coin as it targets retesting previous peaks.


Source: TradingView
Momentum is indicated by the technical indicators. The RSI stands at 70.05, indicating that the asset is overbought and is likely to experience short-term consolidation.
LINK has tough resistance at the 200-day EMA of $11.47. While LINK still shows an uptrend, it must remain above the 100-day EMA of $6.36 (cyan line).
This article contains market analysis and price predictions. These are not guarantees. Crypto markets are volatile. Always DYOR. Not financial advice.
Also Read: Chainlink Price Prediction: LINK Signals Rally As Breakout Targets $20

Be the first to comment