


What to know:
- PEPE is consolidating in a tight liquidity zone around $0.00295–$0.00298, setting up for a volatile breakout or breakdown.
- If PEPE holds the pivot, price may move toward $0.003118–$0.003318, where strong resistance and liquidity sit.
- RSI is recovering from oversold levels, while MACD confirms a bullish crossover and rising momentum.

PEPE price is consolidating in a tight liquidity zone where price is compressed between strong support and resistance levels. A breakout could trigger a fast move upward if momentum continues, while losing support may shift pressure downward. Indicators suggest improving bullish momentum after oversold conditions.
At the time of writing, PEPE is trading at $0.000002769 with a 24-hour trading volume of $220.12 million and a market capitalization of $1.14 billion. Following the 2.31% gain over the last 24 hours, the PEPE price structure points to new highs.

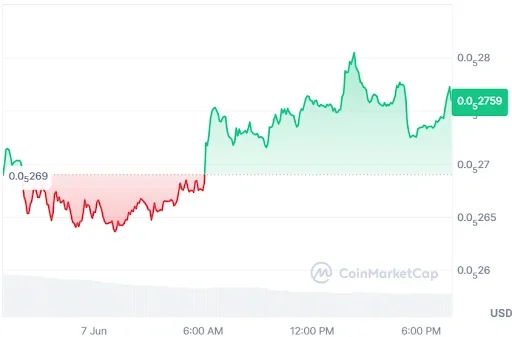
Source: CoinMarketCap

Also read: PEPE Price Stabilizes Above Support as Technicals Hint at a Move to $0.00000729
PEPE Price Setup Points to a 0.0033 Breakout
Furthermore, the crypto analyst ScalpingX highlighted that the PEPE price is currently trading near the 0.00298 region, sitting inside a thin liquidity pocket where price is compressed between two major liquidation zones.
Below, long liquidations stack heavily from 0.002950 down toward 0.002702, while above, short liquidations build more aggressively from 0.003046 up to 0.003354. This imbalance creates conditions for a sharp, fast directional move once liquidity is triggered.
As long as the PEPE price moves above the 0.002950-0.002980 pivot zone, then there is a tilt to the upside for an upside squeeze play; there is more selling in the higher levels than buying, driving the trend higher.
This could see a breakout from 0.003046, with a further move to the 0.003118-0.003318 area where the main liquidity zones are located.
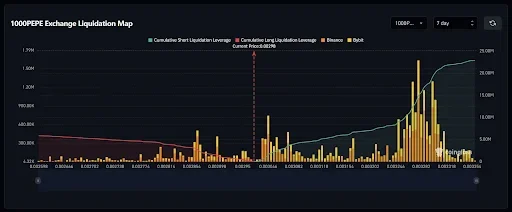

Source: ScalpingX’s X Post
If support does not hold, PEPE could rise initially to 0.002898-0.002854 before eventually moving towards 0.002814-0.002702.
However, the greatest threat is that the very narrow mid-region may prompt swift two-way price swings before anything conclusive comes into play. The PEPE price action is bound to be volatile during pivot break-outs and resistance tests at 0.003246-0.0
Momentum Indicators Point to Improving Sentiment
According to TradingView, RSI has managed to make a quick recovery from its highly oversold level position. Following its steep fall close to its lowest level on about June 5 due to high selling volume, it has quickly bounced back. The purple line now stands above the yellow signal line and is currently at 39.83.
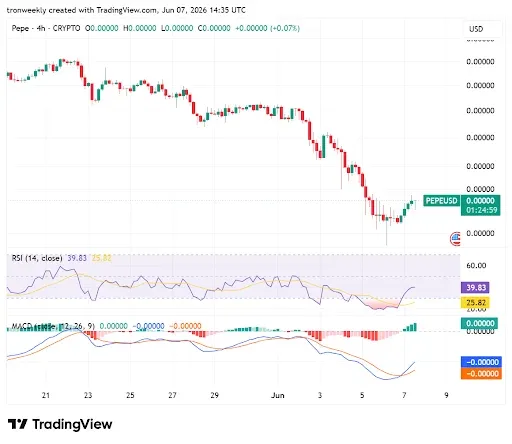

Source: TradingView
The MACD turns out to be the factor that confirms the bullish trend reversal. Following an extreme price decline, the blue MACD line crossed over the orange signal line, creating a bullish crossover pattern. As for the histogram, it confirms the breakout in a positive way through thinning green bars instead of large red ones.
This article contains market analysis and price predictions. These are not guarantees. Crypto markets are volatile. Always DYOR. Not financial advice.
Also Read: PEPE Price Hints at a Reversal to $0.00000349 as Falling Wedge Pattern Forms
Be the first to comment