


PEPE price has held above $0.000004 as its September rally cools, with improving weekly momentum facing a bearish short-term setup near $0.0000041.
Summary
- PEPE price traded near $0.00000433, above its daily Bollinger midpoint but below the recent September peak.
- Daily RSI stood at 57.96, while the weekly MACD histogram remained above zero.
- Crypto With Gopal identified $0.0000041 support and a potential downside target near $0.0000030.
- CoinGlass showed liquidation concentrations near $0.00000416 below price and $0.00000444–$0.00000452 above it.
TradingView’s Binance PEPE/USDT daily chart showed the token at $0.00000433 on Sep. 30, up 1.64% from the daily opening price. The session ranged between $0.00000423 and $0.00000452, with PEPE retreating from the upper end of that range.

The token remained below its September spike above $0.0000053. At $0.00000433, PEPE was roughly 18% below that level, although it continued to trade above the area around $0.0000035 where it spent part of the month before the rally.
PEPE holds above its $0.00000402 daily midpoint
On the daily chart, PEPE traded above the 20-day Bollinger midpoint at $0.00000402. The upper band stood at $0.00000502, while the lower band was at $0.00000302.
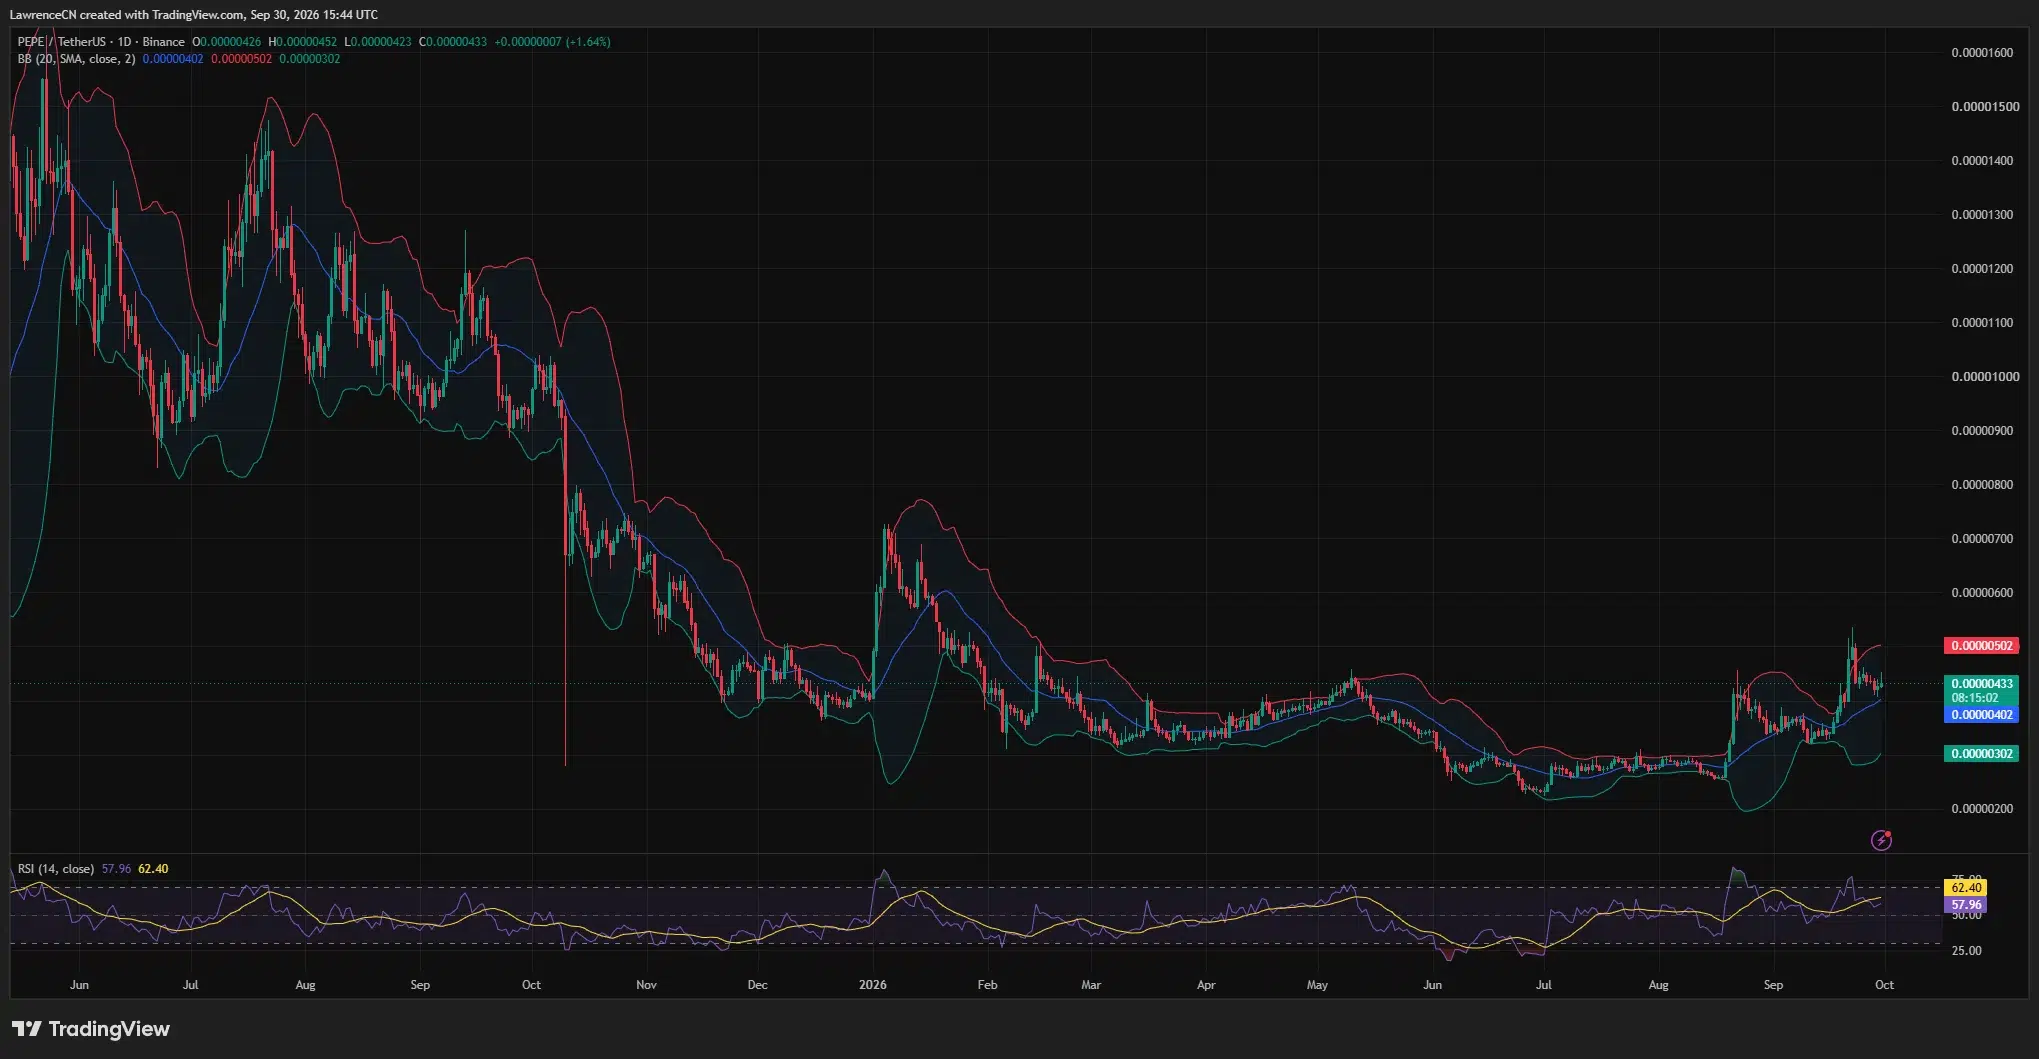
The price was roughly 7.7% above the midpoint and 13.7% below the upper band. A return to $0.00000502 would require a gain of about 16% from the daily chart’s price, before another test of the September peak.
Daily relative strength also remained above its neutral threshold. The 14-day RSI stood at 57.96, below its moving average of 62.40 and below the overbought readings reached during the recent surge.
Taken together, the daily readings showed a pullback with price still above its short-term average. The RSI’s position below its own average pointed to weaker momentum than during the rally, while its reading above 50 left the daily setup stronger than during the summer lows.
The $0.00000402 midpoint sits close to the round-number $0.000004 area. Below that zone, the daily chart shows September trading around $0.0000035, followed by the lower Bollinger band near $0.00000302.
Weekly momentum improves beneath $0.00000805 resistance
The weekly TradingView chart showed PEPE at $0.00000435, above the descending trendline drawn from the 2025 highs. Price also stood above the 20-week simple moving average at $0.00000324 and the 50-week average at $0.00000396.
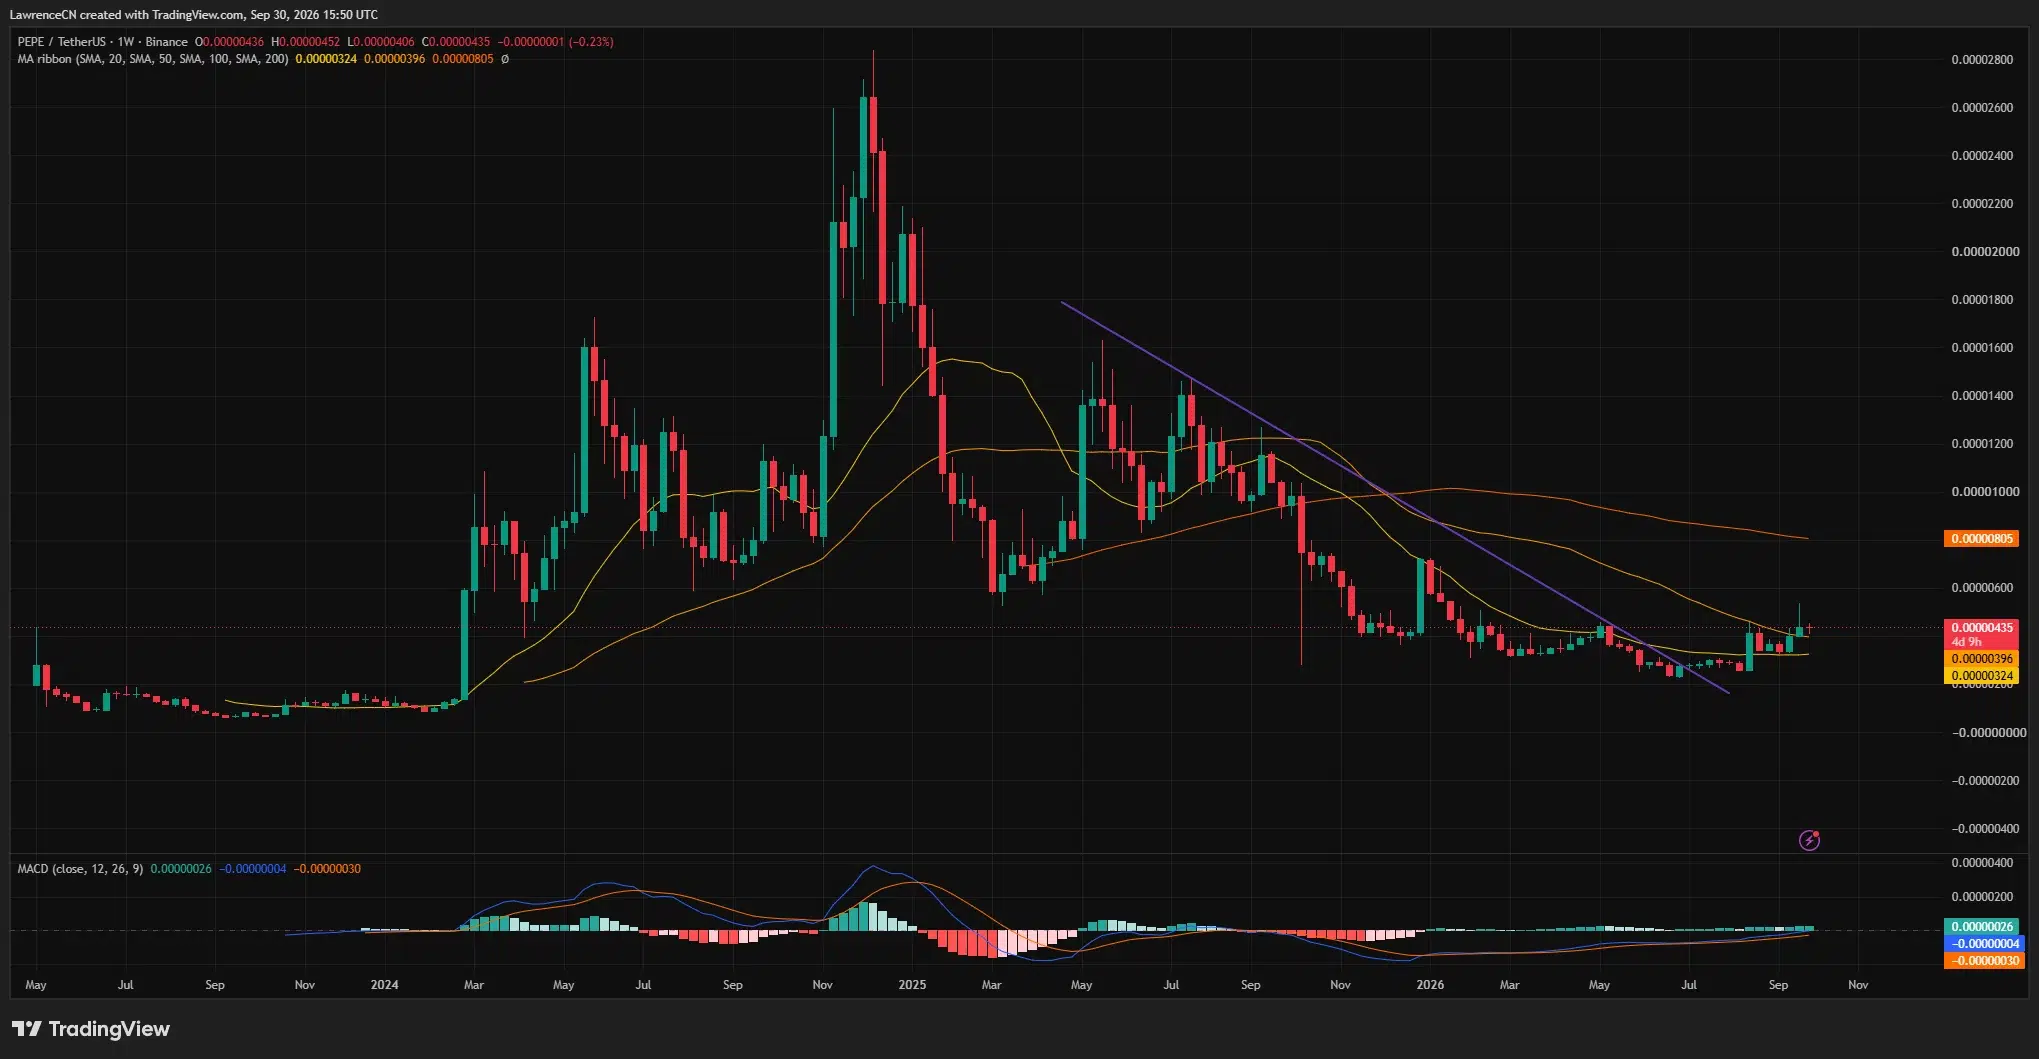
However, the 100-week average remained much higher at $0.00000805. PEPE would need to gain about 85% from the weekly chart’s price to reach that average, leaving a wide gap between the recent recovery and longer-term overhead resistance.
The weekly MACD line was above its signal line, with a positive histogram reading of 0.00000026. Both lines remained below zero: the MACD line was near -0.00000004 and the signal line near -0.00000030.
That combination showed improving weekly momentum while the MACD remained below its zero line. The positive histogram followed an extended period of weak readings during PEPE’s decline from its earlier highs.
Analyst Moustache on Sep. 28 described PEPE as having broken out of a 2.5-year falling wedge. His weekly chart marked price above the pattern’s upper boundary, presenting a bullish longer-term view without naming a price target.
A break below $0.0000041 could expose $0.0000030
Crypto With Gopal offered a more cautious view in a Sep. 29 post, identifying a narrowing formation on PEPE’s 4-hour chart. He labeled the pattern a bearish pennant and placed key support at $0.0000041.
According to the analyst, a breakdown could open a move toward $0.0000030. From the daily chart’s $0.00000433 price, that projected level would represent a decline of about 31%.
He placed the bearish setup’s invalidation level around $0.0000047. A move above that resistance would challenge his downside view and bring PEPE closer to the daily upper Bollinger band at $0.00000502.
His downside target also sits close to the daily lower Bollinger band at $0.00000302. The two levels come from different methods: one is a projected chart-pattern target, while the other is a volatility-band reading.
The analyst’s short-term warning contrasts with Moustache’s weekly breakout view. PEPE’s position above the weekly averages can coexist with a pullback on the 4-hour chart, with $0.0000041 and $0.0000047 framing the nearer-term scenario.
Liquidation clusters build on both sides of PEPE
CoinGlass’s three-day liquidation heatmap showed PEPE rising toward $0.0000045 on Sep. 30 before falling back toward $0.0000043. Overhead concentrations appeared around $0.00000444–$0.00000452, with another band near $0.00000458.
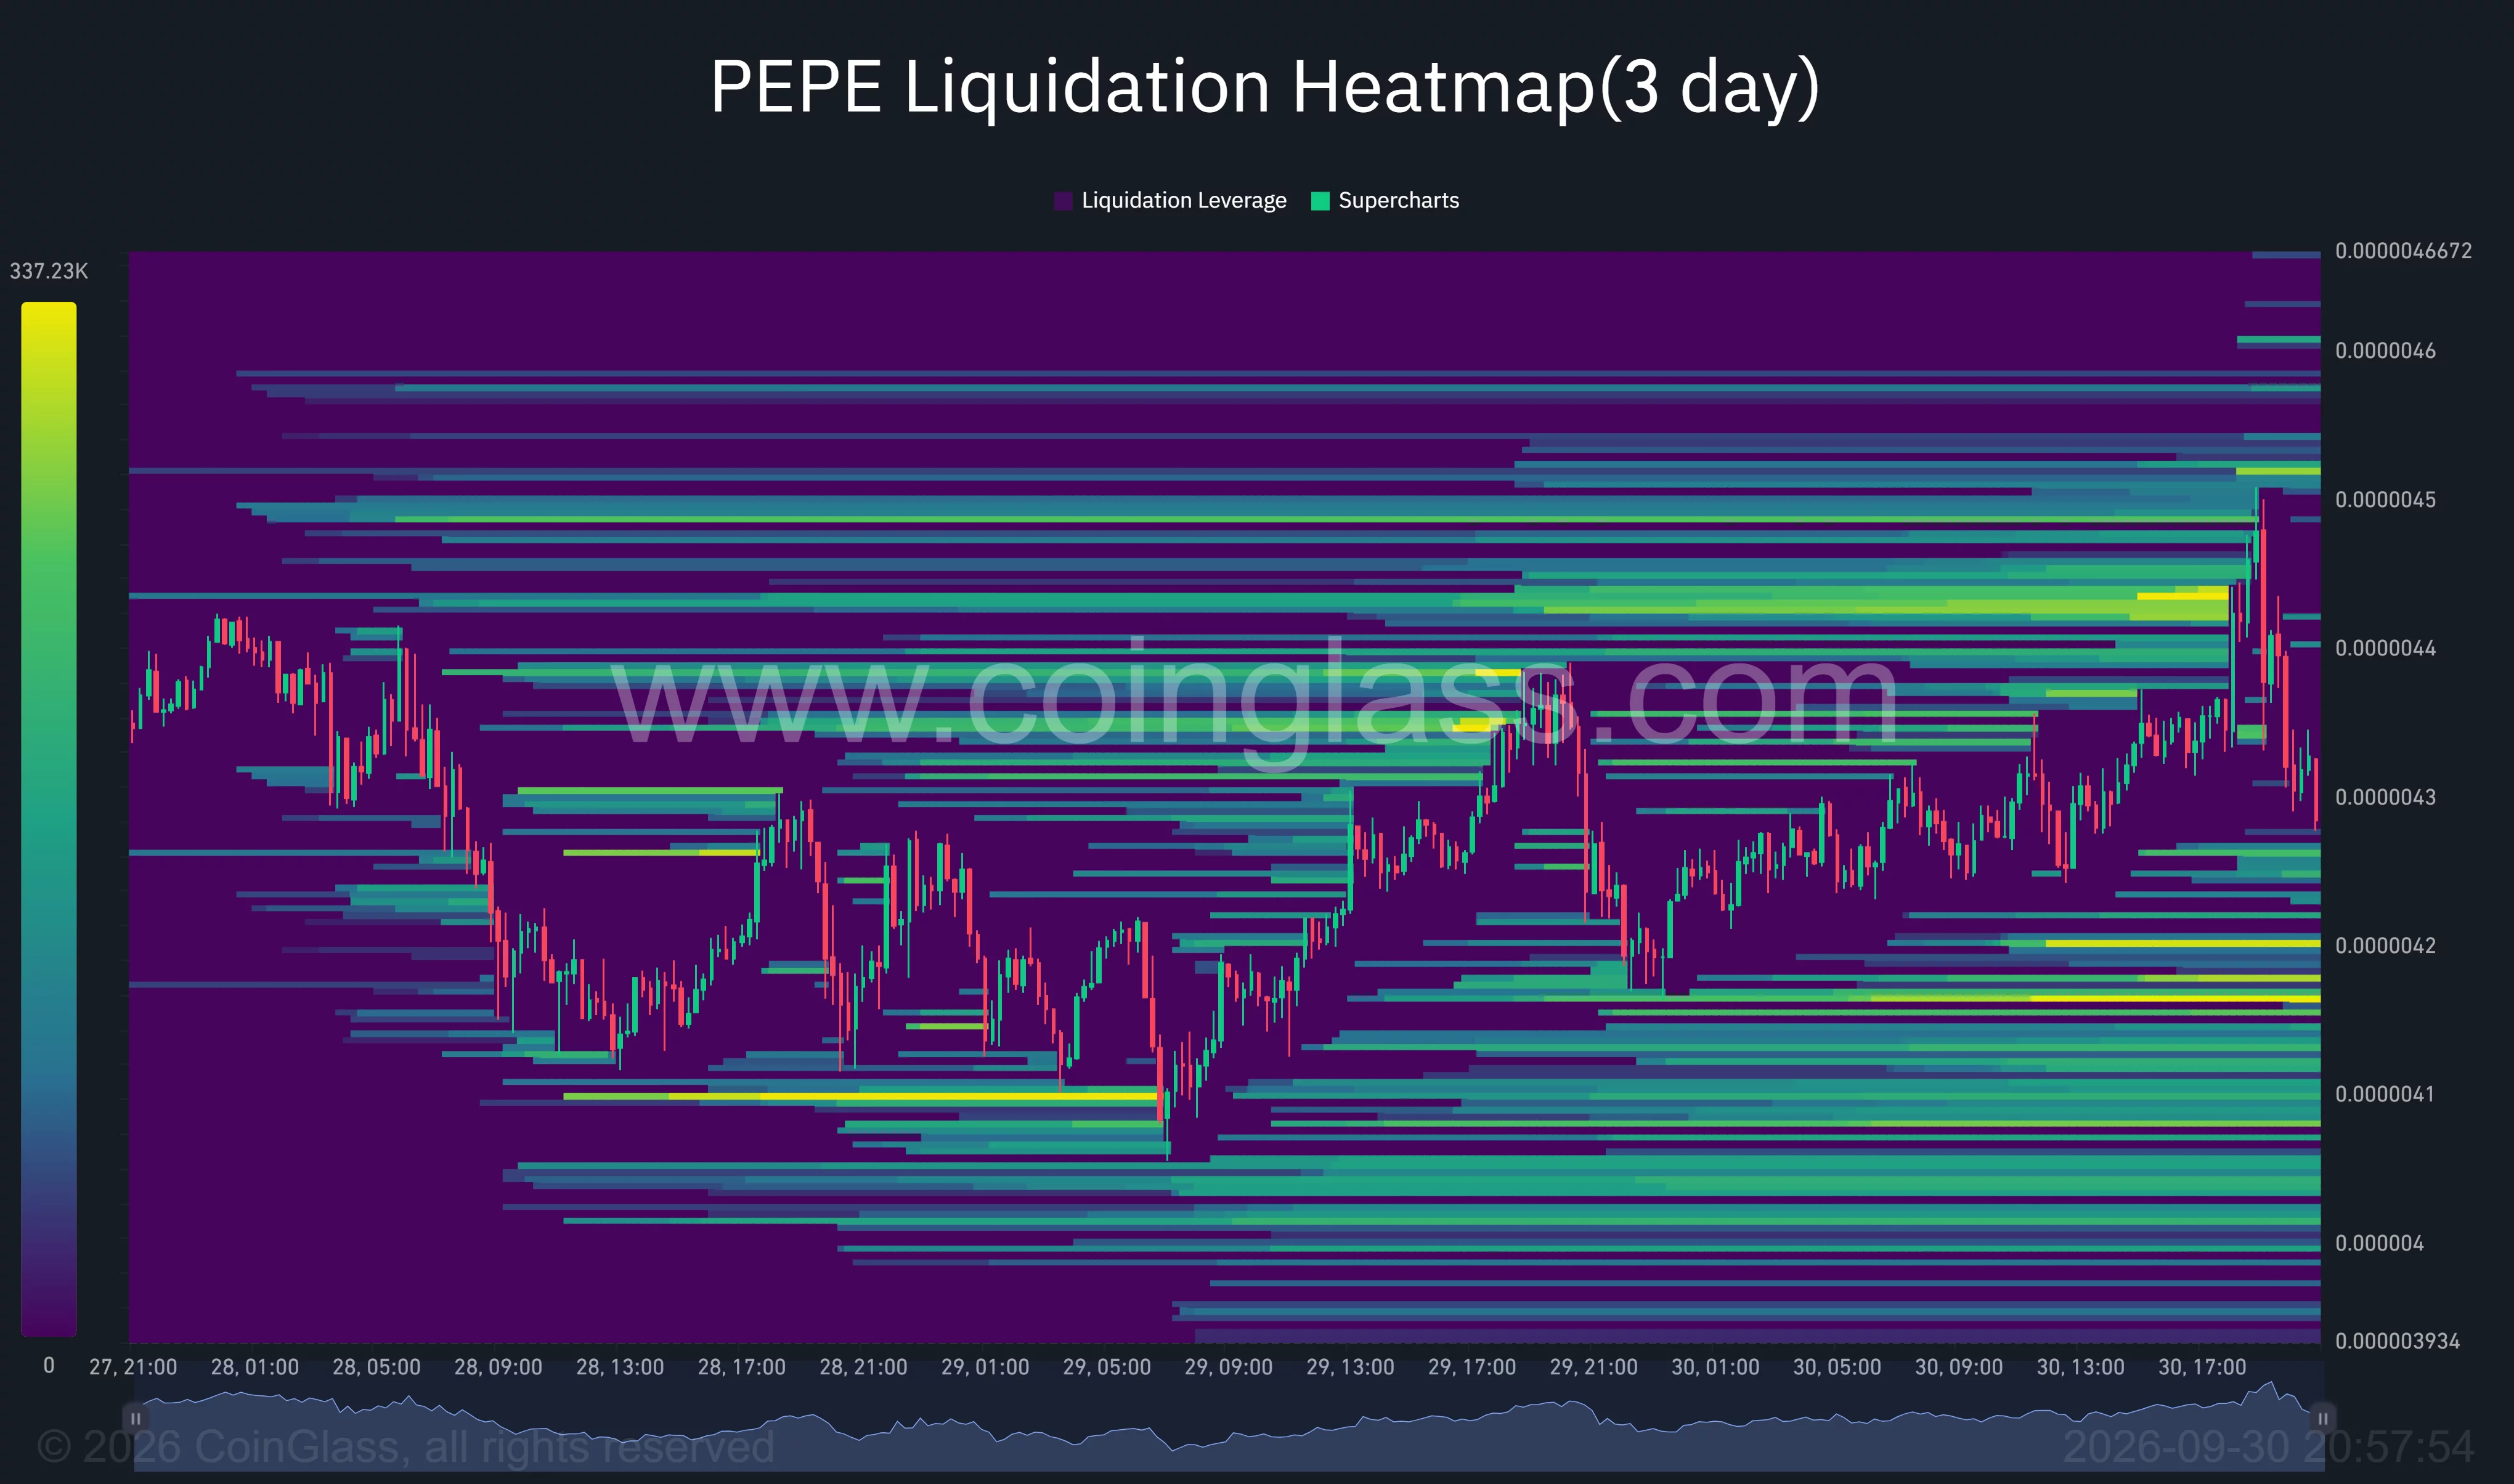
Below price, a bright cluster sat near $0.00000416, followed by concentrations around $0.00000408 and $0.00000404–$0.00000406. The $0.00000416 area lies close to the support identified in the 4-hour analyst view.
For U.S. holders, the SEC’s Division of Corporation Finance said in its Feb. 27, 2025 staff statement that typical meme coins derive their value mainly from speculation and market demand. The staff said transactions in the meme coins it described generally fall outside federal securities laws, while stressing that individual arrangements require a facts-based assessment.
The statement has no legal force and does not constitute a Commission rule. The staff also said fraud involving meme coins may remain subject to action under other federal or state laws.
Disclosure: This article does not represent investment advice. The content and materials featured on this page are for educational purposes only.



Be the first to comment