



Sei Price Climbs 8.62% as Technical Momentum, Derivatives Activity, and New Trading Developments Capture Attention. A steep recovery has driven Sei back toward a crucial resistance area, while market activity hints at growing participation.
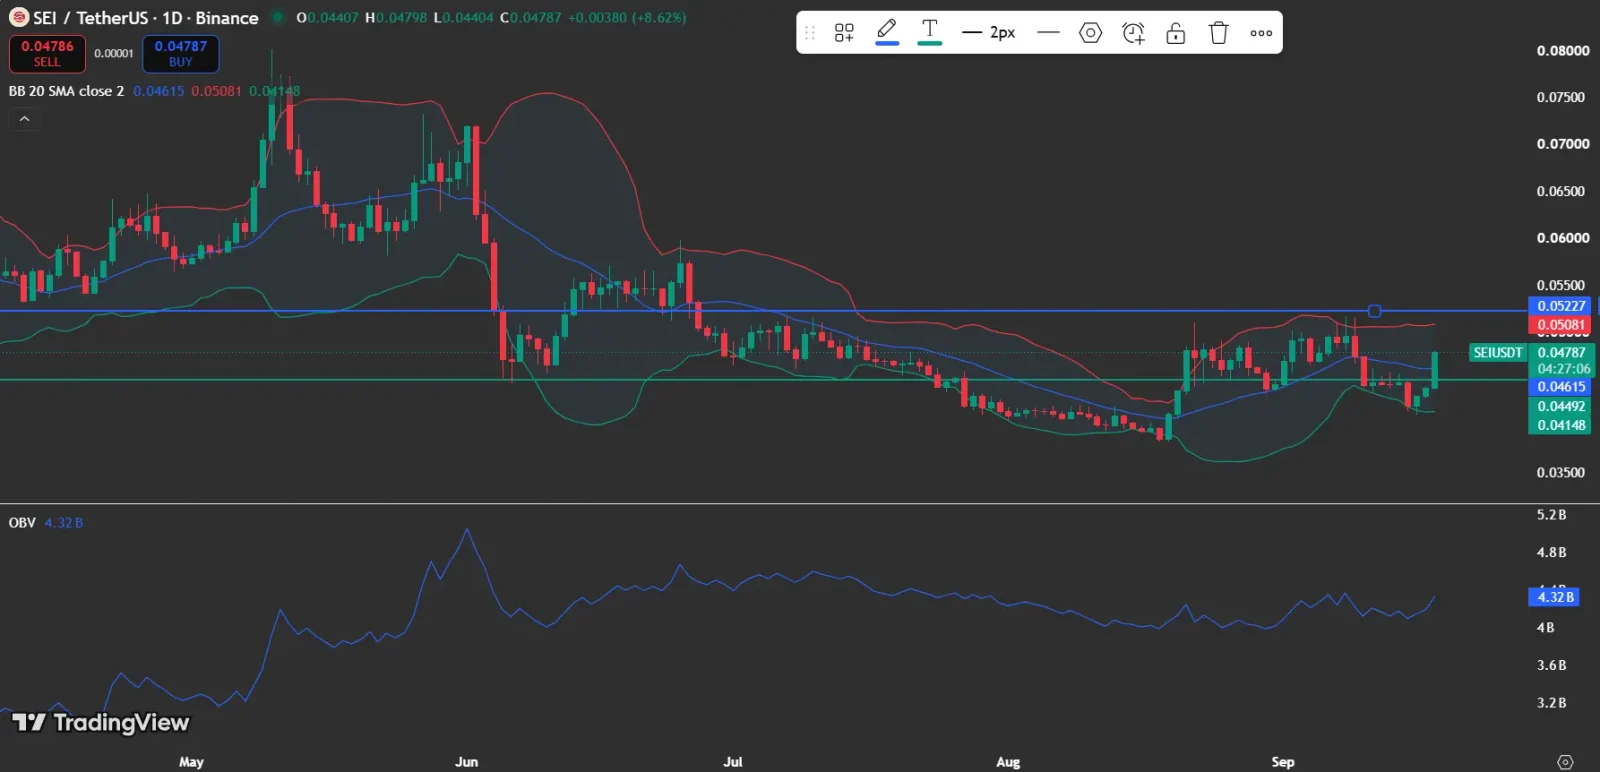
As of press time, Sei is trading at $0.04787, marking an 8.62% gain over the last 24 hours. This advance has lifted SEI above its Bollinger middle band, while open interest, volume, and OBV have all strengthened alongside the price recovery.
Also Read: Sei Price Recovers Toward $0.045 as Network Activity Rises
Sei Price Regains Key Bollinger Level
The TradingView chart indicates SEI is trading above the $0.04615 Bollinger middle band and below the upper band at $0.05081. This positions price in the upper half of the recent range, lending the rebound a constructive technical foundation.

The nearest resistance sits at $0.05227. A sustained push beyond that level would offer stronger confirmation of a breakout, whereas $0.04492 serves as the first nearby support.
What Is the Sei Price Chart Indicating?
OBV has risen to roughly 4.32 billion, climbing in tandem with the latest price recovery. The rise in OBV alongside price suggests that buying pressure has strengthened rather than the move occurring without broader volume support.
The Bollinger setup still allows room for volatility. A rejection around $0.05081 could push SEI back toward $0.04615 or $0.04492, while a break above $0.05227 would direct attention higher.
Also Read: DOJ Crypto Seizure Targets Xinbi in $52M Crackdown
How Are Sei Price Derivatives Shifting?
CoinGlass data indicates open interest near $53 million, following a sharp increase in open interest during September. Trading volume has also generated several major spikes, including stretches above $100 million.
The most recent volume remains elevated compared with the quieter August sessions. Rising price alongside renewed open interest indicates traders are increasing derivatives exposure, although the chart alone cannot determine whether that positioning is mostly long or short.
What Is the Significance of the Sei Price Rally?
According to DeFiLlama data, Sei’s TVL stands at roughly $32 million, with repeated surges in DEX volume and active addresses. The wider network activity offers further context for the recent price recovery.
Sei also called attention to a new trading development from Saphyre, posting: “More trading, coming to Sei.” Saphyre stated that its perps webtestnet waitlist would open in 48 hours, adding a derivatives-related catalyst to the technical setup.
The embedded Saphyre post also uses the phrase “All the leverage. None of the games.” and says the waitlist for Saphyre Perps on webtestnet would open in 48 hours, making the development particularly relevant to the derivatives activity shown in the CoinGlass data.
Also Read: Sei Price Gains 8.40% as Network Development Accelerates
Could Sei Price Surpass $0.05227?
The bullish case hinges on SEI clearing the upper Bollinger Band at $0.05081 and then breaking through the $0.05227 resistance. A failure to hold $0.04492 would undermine that setup and shift attention to the lower Bollinger Band near $0.04148.
On the whole, the technical picture points to a strong short-term rebound, backed by rising OBV and renewed derivatives activity.
The Saphyre development provides a fundamental catalyst, yet price confirmation above resistance remains essential.
Cryptocurrency markets stay highly volatile, and traders should watch price action, market sentiment, and upcoming catalysts before making investment decisions.
Also Read: SEI Price Eyes $0.060 as Lower Fees and Rising Trading Activity Fuel Hope
This article contains market analysis and price predictions. These are not guarantees. Crypto markets are volatile. Always DYOR. Not financial advice.



Be the first to comment