



Shiba Inu is testing resistance near $0.000006 after expanding its trading access through Solana, with the latest rebound bringing price back to the ceiling of its recent consolidation.
Key Takeaways
- SHIB is testing resistance around $0.00000591-$0.00000600.
- Sunrise’s listing adds Solana trading access.
- $0.00000550 remains a deeper level defended during pullbacks.
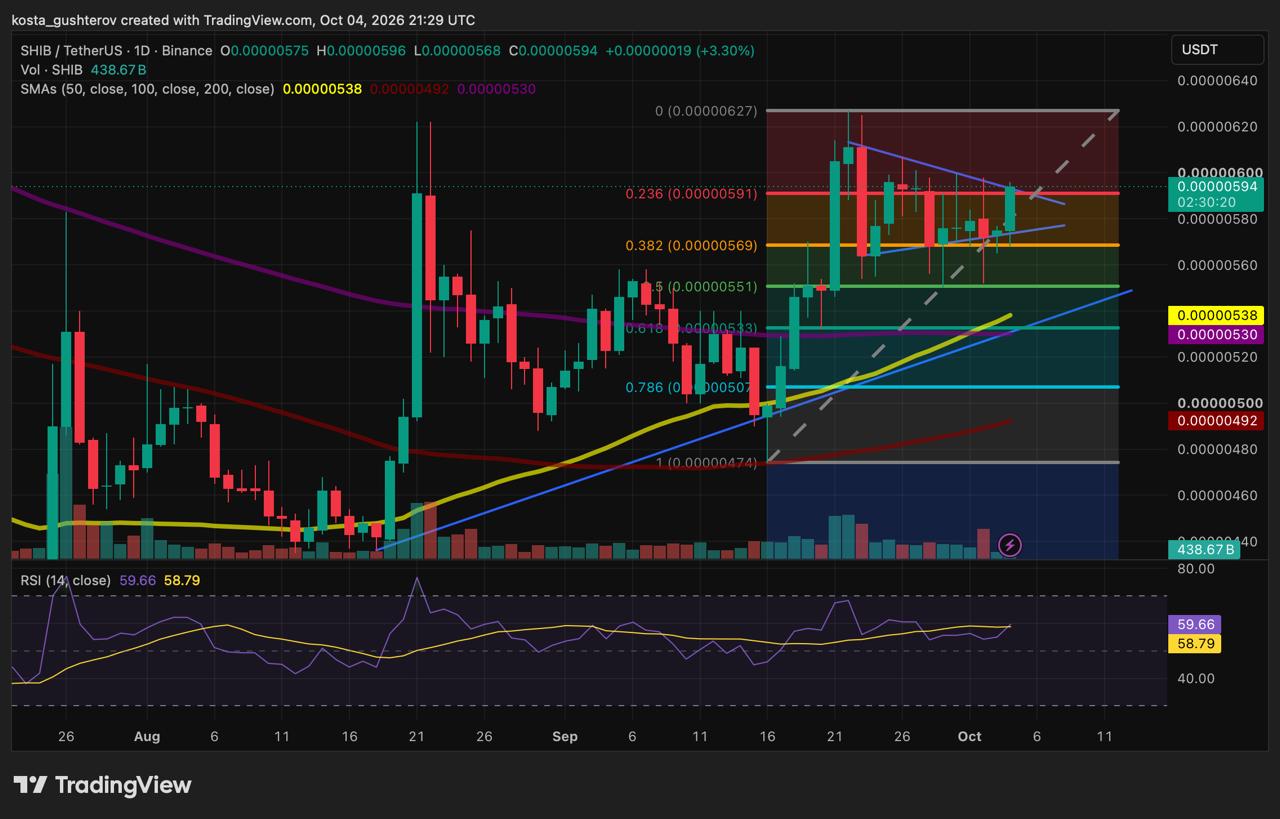
By 21:29 UTC on October 4, SHIB had bounced from its session low near $0.00000568 to approximately $0.00000594 on Binance. The recovery left the open daily candle up about 3.30% from its opening price, but close to the descending line that had restrained earlier rebounds.
Solana gives SHIB another route to traders
The rebound coincided with Sunrise’s October 4 announcement that SHIB was listed on Solana, a development also confirmed by Solana’s official account. The listing adds access to the Ethereum-origin token through Solana applications, giving traders already using that ecosystem another market to buy or sell it.
Sunrise describes the listed version as canonical. The Solana Foundation’s explanation of Sunrise describes how a shared token address helps wallets and trading applications coordinate around one preferred representation. Other versions can still exist, so the SHIB entry in Solana’s token registry gives traders a reference for checking which asset they are accessing.
Making that version easier to find and trade can improve access, but it does not establish additional buying demand. Existing holders also gain another place to sell, and a busy market can reflect the same tokens changing hands repeatedly. Liquidity and activity that persist beyond the listing would provide a better indication of how much interest the new venue retains.
The announcement follows pressure on meme-linked tokens reported on October 3. Against the recent weakness, SHIB has a fresh development to attract attention. Whether the attention translates into a stronger price recovery depends on how buyers handle the resistance already visible on its daily chart.
The rebound has reached the narrowing range’s upper edge
September’s sharp advance gave way to a series of lower highs, while recent pullbacks began stopping at higher levels. Connecting those points produces the small blue symmetrical triangle: sellers have capped rebounds sooner, but buyers have also stepped in earlier, narrowing the space between them.
Because the formation is short and follows a strong advance, some traders would call it a pennant. StockCharts’ pattern guide notes that the pennant label is commonly used for formations lasting less than three weeks. Several wicks cross the blue boundaries here, however, so the lines describe a tentative consolidation pattern rather than an exact barrier on every session.
October 4 illustrated that distinction. Price briefly fell below the rising lower boundary before recovering toward the descending upper line. Buyers reversed the dip, but the daily session had not finished, leaving the strength of that recovery dependent on whether SHIB could retain the higher price.
The RSI offers some support for the rebound. At 59.66, it was above the neutral midpoint of 50 and slightly above its smoothing line at 58.79, indicating positive momentum without an overbought reading. The narrow gap between the two lines makes the improvement modest; price still needs to escape the range.
Volume generally declined from the September advance as trading narrowed. A pickup during a break above resistance would strengthen the evidence of participation, although the latest volume bar remained incomplete. Those bars also record Binance trading, so even a larger completed bar would not quantify buying in SHIB’s new Solana market or establish what caused the rebound.
Holding above $0.000006 would reopen the September highs
The descending boundary lies near the 0.236 Fibonacci retracement at $0.0000059, putting the first resistance area between that level and $0.00000600. SHIB was slightly above the retracement, but still needed to clear the wider area where its recent advances had stalled.
A daily close beyond the formation followed by sustained trading above resistance would give the move more substance. A later pullback that attracts buyers near the broken boundary would strengthen the case that it is becoming support. Closing back inside the triangle and struggling to recover would instead suggest that the initial break had failed.
If buyers maintain the higher range, the next obstacle is $0.00000620–$0.00000627. The August and September advances peaked around that area, making it a visible test of whether SHIB can progress beyond its previous highs.
$0.00000550 separates a setback from a deeper support loss
A rejection near resistance would first return attention to the triangle’s rising edge, roughly $0.00000573-$0.00000575 on October 4, and the 0.382 retracement just below it. The diagonal moves higher over time, while the horizontal area around $0.00000550-$0.00000555 records repeated pullbacks that buyers have already absorbed.
Fibonacci levels use the September low near $0.00000475 and high near $0.00000625.
Beneath those first support areas, the moving averages provide context for a larger retreat. The 50 SMA is near $0.00000538, above the 200 SMA at $0.00000530 and the 100 SMA at $0.00000492. SHIB’s position above all three supports the broader recovery, but leaves considerable room for a pullback before price reaches them.
Losing the small triangle would therefore weaken the immediate rebound without, on its own, undoing the entire September advance. Repeated closes below $0.00000550 would be more consequential: buyers would have surrendered an area defended during earlier declines, bringing the moving-average cluster and longer rising trendline into focus.
A move above $0.000006 that survives a later pullback would show buyers maintaining higher prices beyond the current range. Repeated rejection would keep SHIB inside its consolidation despite the expanded trading access.
Chart source: TradingView, SHIB/USDT on Binance, October 4, 2026, at 21:29 UTC.
This article is for informational purposes only and does not constitute investment advice. Technical levels are approximate and do not guarantee future price movements.

Alex is Editor-in-Chief of Coindoo and co-founder of Millennial Media Group, with nearly a decade of experience covering financial markets – crypto first, then everything else.
It started in 2016 with Bitcoin. Like most people at the time, he didn’t fully understand it – so he kept digging. Blockchain, tokenomics, the projects, the cycles. That curiosity never stopped, and eventually pulled him into traditional markets too: equities, commodities, macro. Not because he left crypto behind, but because you can’t properly understand one without the other.
What drives him is straightforward: he wants to know why something is happening, not just that it’s happening. Most market coverage stops at the headline – price up, price down, here’s a chart. Alex finds that kind of reporting actively unhelpful. If you walk away from an article without understanding the mechanism behind the move, what did you actually learn?
He holds a degree in Tourism from New Bulgarian University – not the most obvious path into financial markets, but markets have a way of pulling in people who are simply too curious to stay out. He has authored over 200 in-depth analyses and more than 10,000 articles across crypto and traditional finance. He still thinks every day in markets teaches him something new. That’s probably why he hasn’t stopped.



Be the first to comment