



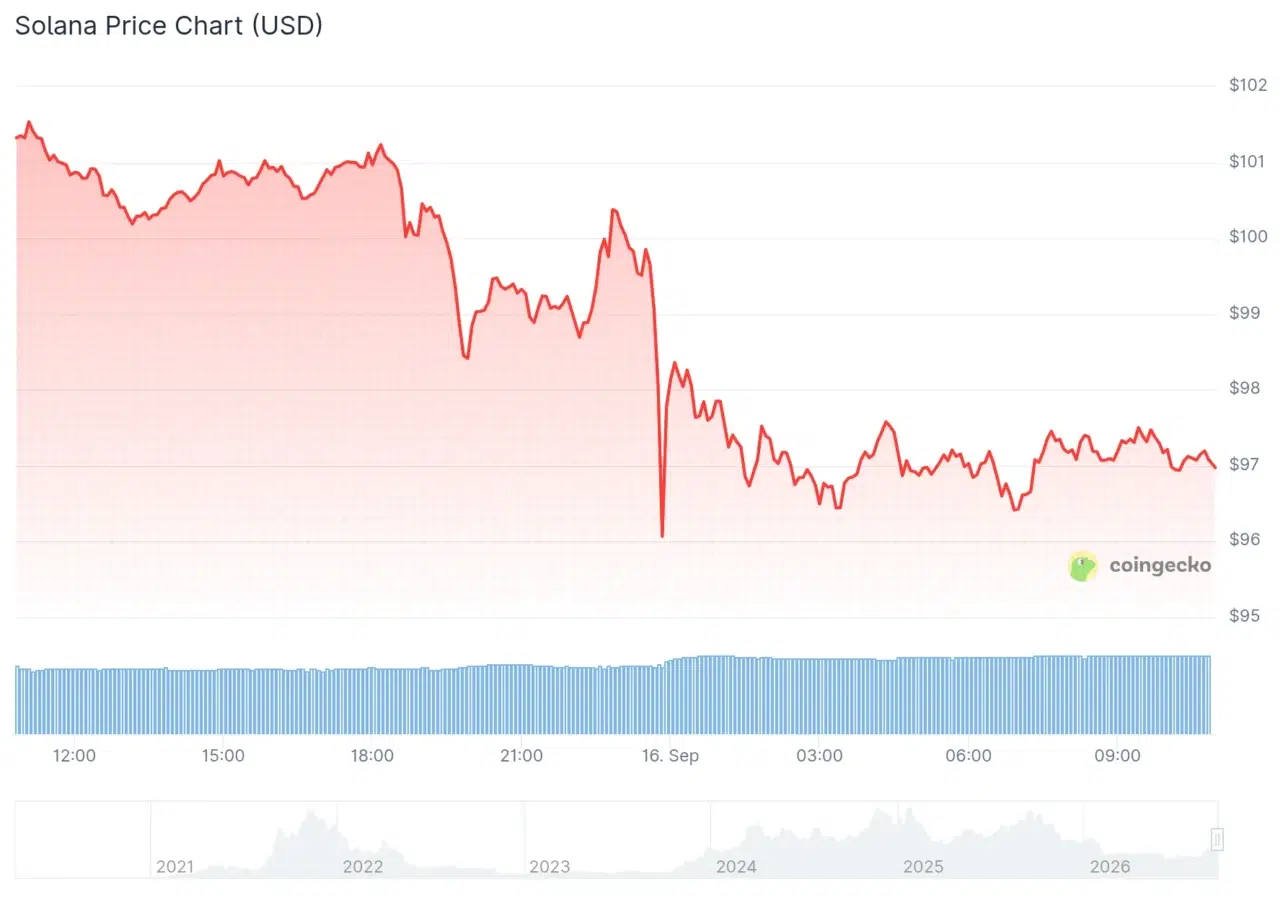
Solana price is facing renewed selling pressure after SOL fell nearly 4% over the past 24 hours. The recent drop in the cryptocurrency market has seen the price of the Solana token fall below many technical support levels, and derivatives trading activity has also picked up.
Currently, Solana (SOL) is trading at $97.34, and the coin has a trading volume of $6.82 billion and a market cap of $57.14 billion. The crypto makes up 2.22% of the entire crypto market, and over the last 24 hours, its price has dropped 3.99%.
Also Read | KRW1 Stablecoin Targets 175M Visa Merchants Through Rain
Solana Risks Decline Below $60 Support
According to a recent post by crypto analyst Alex Marzell, there was a broader price range of SOL ranging between $60 and $149. Presently, the price of SOL trades at approximately $97, which places the cryptocurrency comfortably within this broader range following its failure to maintain the higher levels.

As per the analysis, the level of $104 has become a key level where the next significant movement can be witnessed. If SOL manages to recover above this level, then it will likely make its way to $193. Conversely, if the cryptocurrency breaks down below the broader $60 support, then it may fall to much lower levels with $29 being one of the potential areas.
The analysis also points to about $1.4 billion in SOL held through spot ETFs. This provides additional context around institutional exposure to Solana while the token continues to trade below previous highs.
Technical Indicators Signal Near-Term Weakness
Technical data from the past few days has indicated that SOL is in a slightly weakened state at the moment. The crypto coin had been trading at around $101.16, with the four-hour STC trend indicator now showing a downtrend.
The token is currently below both its 21-period EMA at $101.48 and 55-period EMA at $101.72. The two technical indicators are always closely monitored as they determine the short-term momentum trend for the crypto asset. The fact that both indicators have maintained a level above SOL means they can serve as short-term resistance.
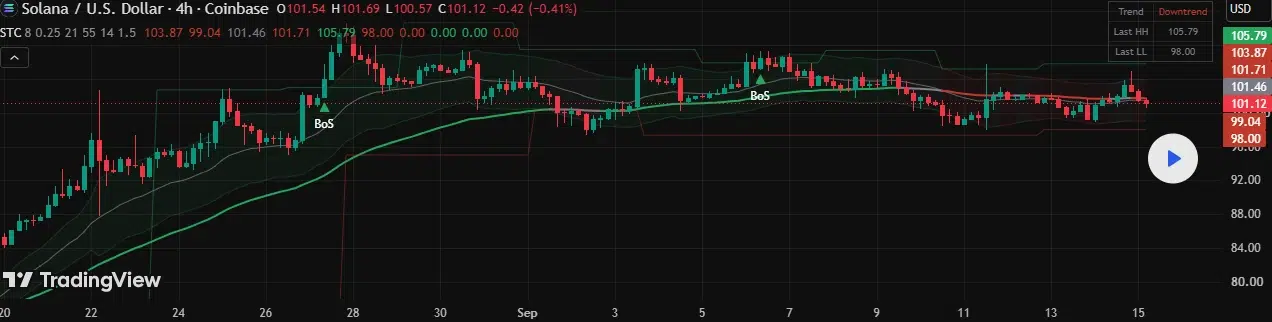
The four-hour volatility band has its top boundary set at $103.88 and bottom boundary at $99.09. SOL is currently sitting below the middle part of this band.
SOL is below its latest swing high of $105.80 and also below its open swing low of $98.00. If the token is able to break out from below $98, the focus should then shift to the bottom levels.
Solana Derivatives Open Interest Records Decline
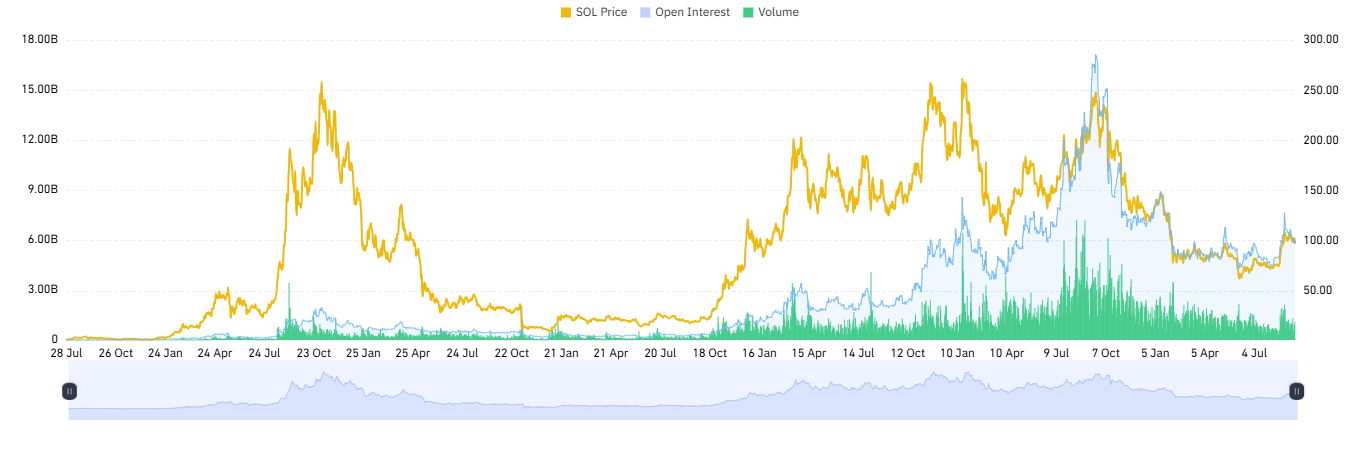
There has also been an increase in the volume of the derivatives on Solana owing to the weakening of the spot price. Derivatives trading volume increased 22.03% to $8.64 billion, showing a notable rise in transactions involving SOL futures and related products.
Meanwhile, open interest fell by 1.03% to stand at $5.87 billion. It is worth noting that the rise in trading volume and the fall in open interest mean there has been growth in trading activity without an equivalent growth in open interest.
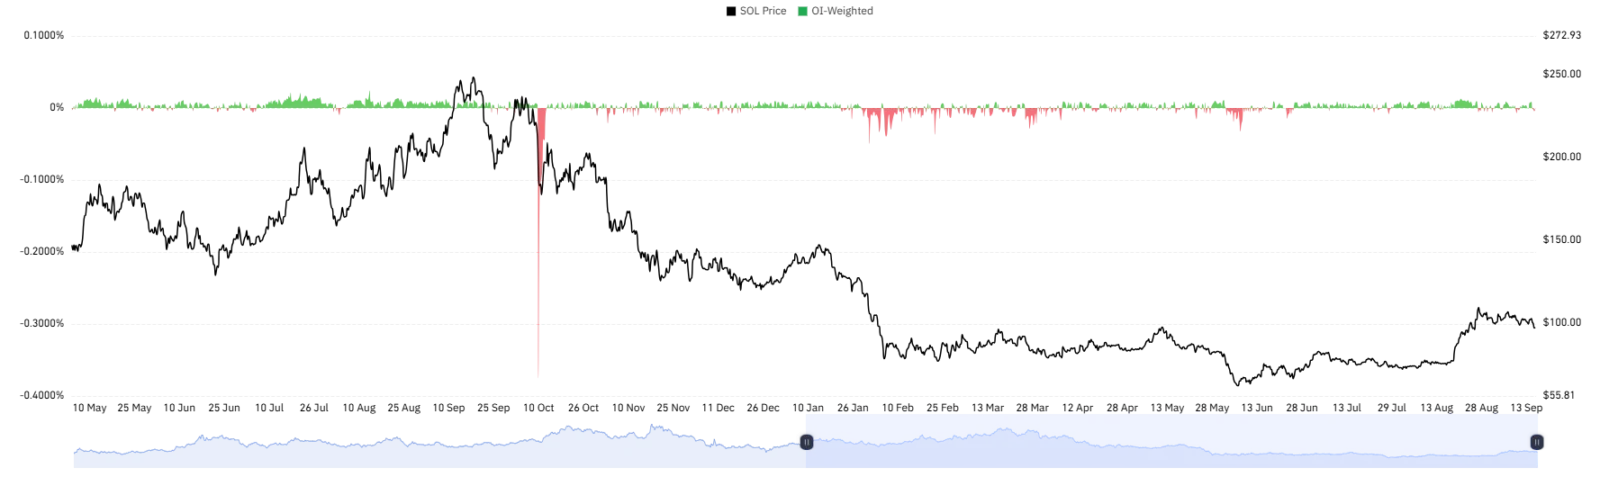
The OI-weighted funding rate is currently -0.0043%, reflecting a slightly negative reading. The relatively small figure points to some downside positioning but does not, on its own, confirm aggressive selling pressure.
The options volume has also experienced growth. Solana options volume rose by 20.20% to reach $25.49 million, while the options open interest rose by 3.42% to stand at $145.05 million.
Solana Price Faces Key Resistance Near $102
From a technical perspective, the $101.70-$102.00 region remains an important resistance area. A rejection from this zone followed by another four-hour close below the 21 EMA could reinforce the current bearish setup.
The first downside level sits near $99.09, followed by the $98.00 swing low. A deeper move could bring approximately $96.40 into focus, representing a further extension below the identified swing.
On the upside, a four-hour close above $103.88 would weaken the current downtrend setup. A broader recovery above $104 would also become significant because it could shift attention toward the higher levels identified in the larger trading range.
Also Read | Revolut Data Breach Hits 680 Customers as UK Regulators Review Case



Be the first to comment