




TLDR
- SOL has dropped 10% in the past 30 days after breaking a key trend line support
- Solana ETFs saw only $14.6 million net inflows in July and a net outflow in June
- A crossover in daily active user moving averages signals a potential sharp price decline
- SOL trades below its 100-day SMA ($78.06) and 200-day SMA ($84.71)
- Key support levels to watch are $72, $70, and the $66–$67 zone
Solana (SOL) is trading around $73 after falling 10% over the past 30 days. The price broke below a key trend line and has since formed a bearish descending channel on the daily chart.
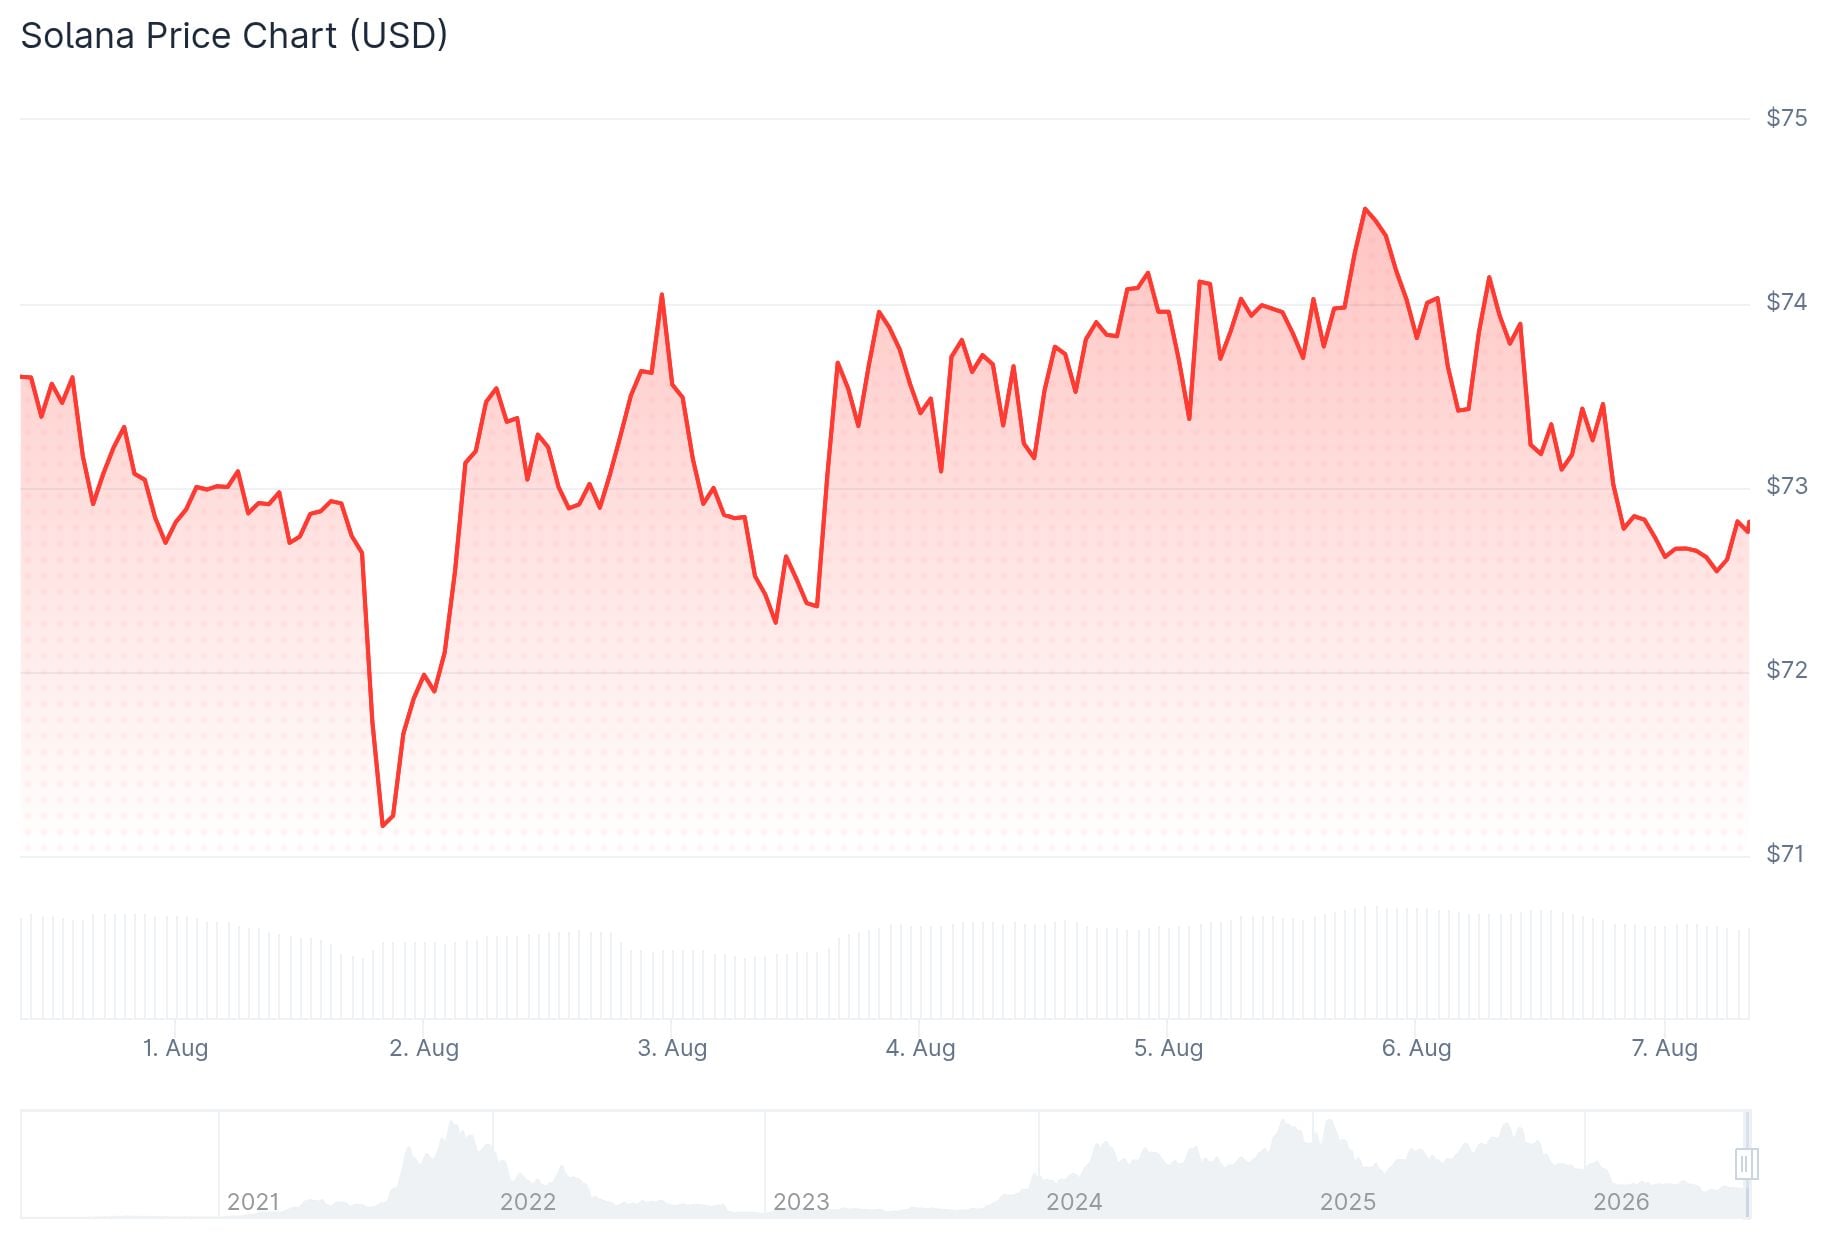
The token is now below both its 100-day simple moving average of $78.06 and its 200-day SMA of $84.71. That keeps the broader technical structure under pressure for now.
Sellers have been in control for several weeks. SOL has been making lower highs since failing to reclaim the July peak near $82. The stochastic oscillator has fallen to 3.06, deep in oversold territory, while the Ultimate Oscillator sits at 38.8.
Investor interest in SOL through ETFs has been thin. Net inflows were just $14.6 million in July, and June saw a net outflow of $800,000. This reflects a lack of fresh capital entering the token.
On-chain, a crossover between the 30-day and 50-day moving averages of daily active users has appeared. In the past, this signal has preceded large price swings for SOL.
On-Chain Activity Tells a Mixed Story
Network usage metrics are showing some strain heading into August. DEX volumes dropped 9% in July to $51 billion. A run rate of August activity so far projects around $44 billion for the month.
Solana in four charts:
1. Solana apps generated $82.9M in revenue in July, the highest since February.
2. Solana’s share of network revenue climbed to 16.5% in July, now third among all chains and ahead of Ethereum.
3. Stablecoin supply grew to $15.7B, an all-time high.
4.… pic.twitter.com/3ImzZByrfR
— Solana (@solana) August 6, 2026

App fees rose slightly from $186 million to $200 million in July. The August projection puts fees at around $220 million, a modest increase.
Despite weak price action, crypto analyst Nebraskangooner pointed out on X that Solana’s fundamentals remain strong. He noted that July was a standout month, with Solana apps pulling in $82.9 million in revenue — the best since February — giving the network 16.5% of all blockchain revenue and putting it ahead of Ethereum for that period. Stablecoin supply hit a record $15.7 billion, and the network processed over one billion non-vote transactions in a single week.
Its most monthly red candles in a row… EVER
10 in a row! Can August break the streak? pic.twitter.com/fjLkk2lzJd
— Nebraskangooner (@Nebraskangooner) August 5, 2026
Valuation Multiples Have Compressed
Back in 2024, SOL traded between $130 and $180 with similar DEX volumes and app fees to today. The market has since lowered how much it is willing to pay for Solana’s activity levels.
In 2024, Solana closed with $662 billion in DEX volumes and $2.55 billion in app fees, with the price reaching $190. This year, DEX volumes are projected near $1 trillion while app fees could reach $2.8 billion — yet SOL sits below $80.
The RSI currently sits at 44. A move below 40 would trigger a sell signal. The descending channel points to a possible retest of $68 support, with the $60 level also in focus if lower supports fail.
First support is at $72. A break there opens the door to $70, then the $66–$67 zone.



Be the first to comment