




TLDR
- SOL is trading near $76, holding key support between $73–$77
- $87 is the next major resistance; breaking it could open a path to $100
- Analyst Michaël van de Poppe says a break below $73 could trigger a test of recent lows
- Long-term charts show a potential accumulation zone between $30–$52 if deeper correction occurs
- Circle minting 250M USDC on Solana signals continued network activity
Solana is trading near $76.33, holding above a short-term support zone between $73 and $76. The price saw a small 24-hour gain of 0.41%, but the broader trend remains uncertain.
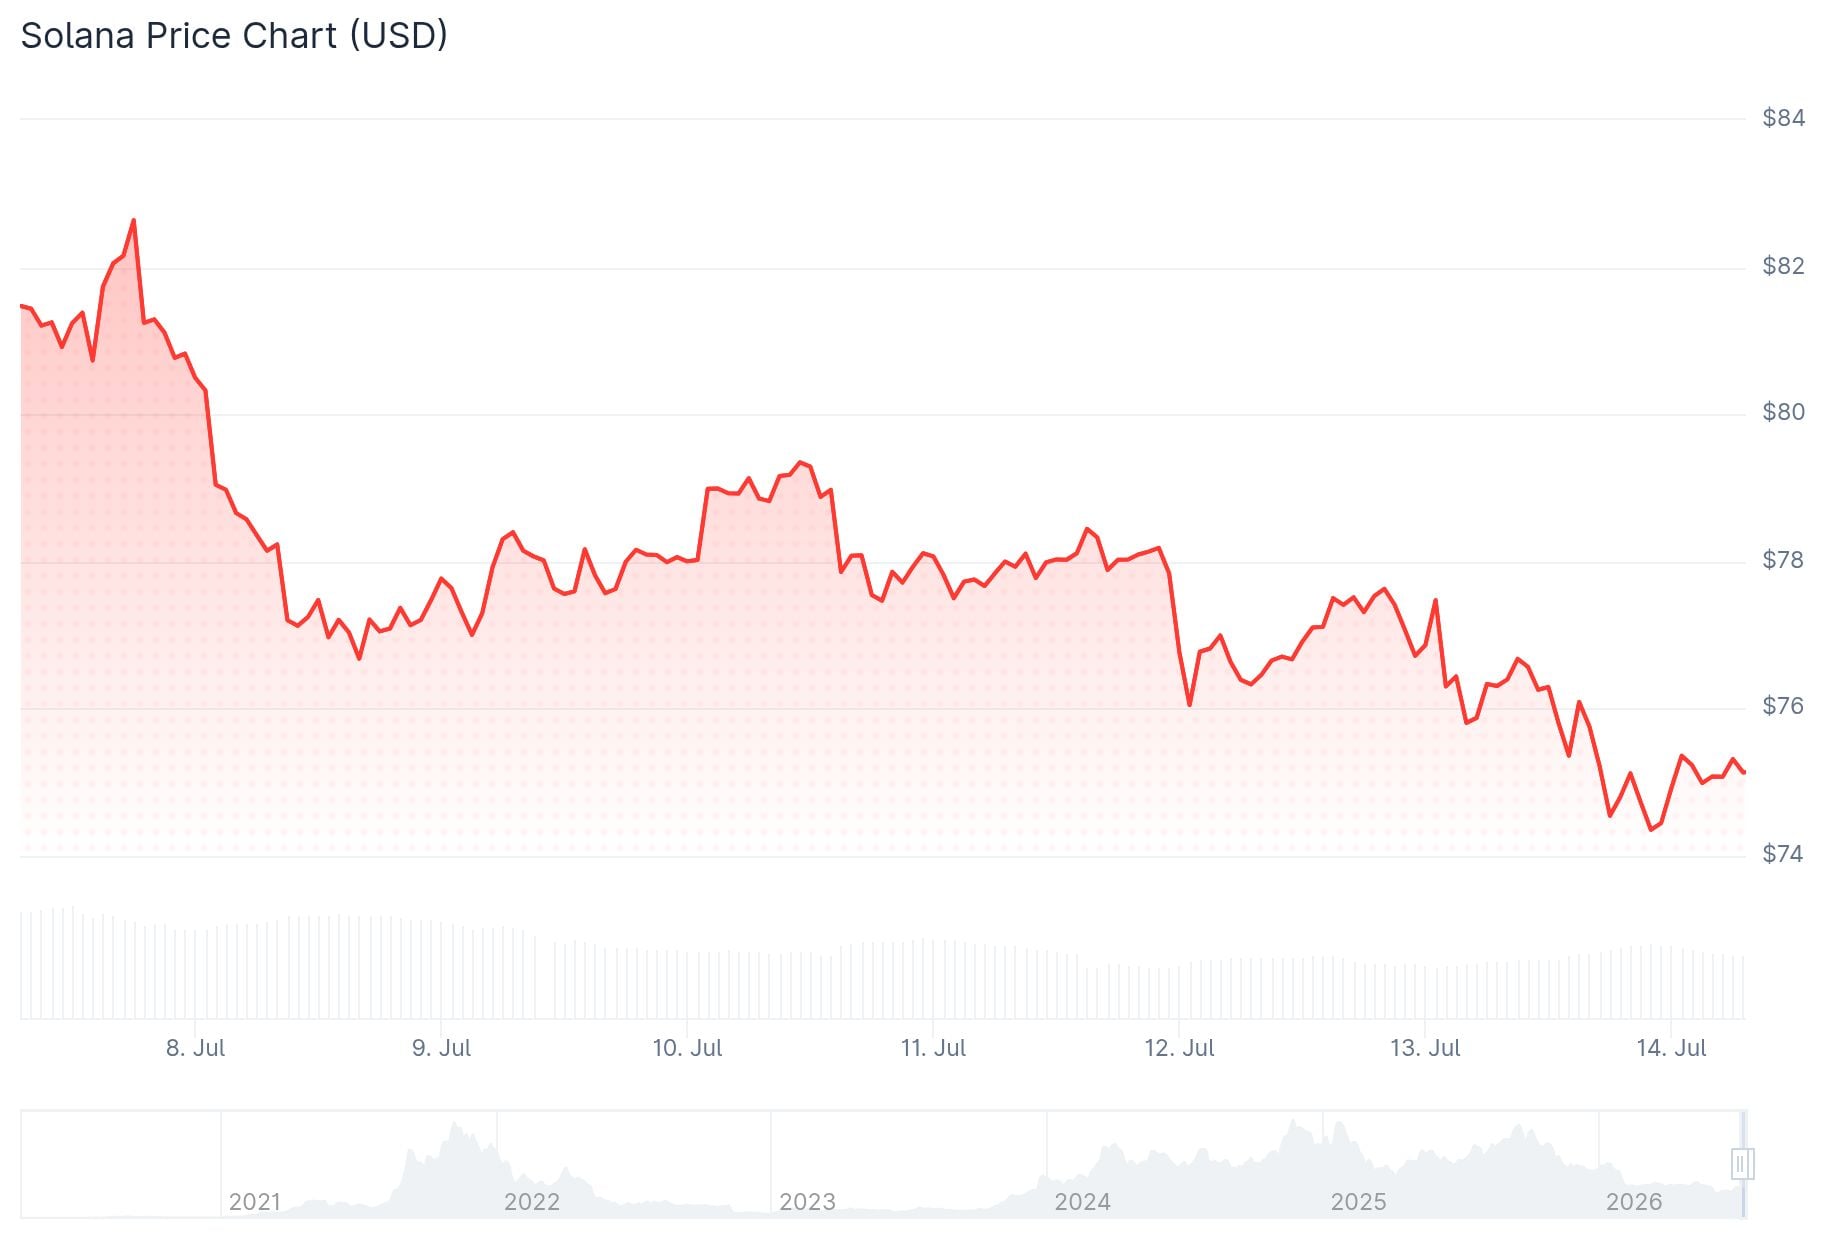
The $73–$76 range is now the most watched area for SOL. Buyers need to hold this zone to keep any recovery setup alive. A drop below $73 could trigger more selling pressure.
On the upside, the first target for bulls is $80. Clearing that level would put $87.20 in focus, which is a key resistance area on the daily chart.
SOL’s Breakout Setup
Traders are watching a long-term downtrend line that SOL is currently pressing up against. Analyst Jesse Peralta’s chart shows price testing this resistance, which has held for months.
A confirmed breakout above this line could shift momentum toward buyers. If that happens, $90 and then $100 become the next key targets.
However, the breakout still needs confirmation. A rejection here and a fall back below $73 would likely restart the bearish move.
Analyst Michaël van de Poppe weighed in on X, calling the current level “make or break” for SOL. He said if the level holds, a quick bounce higher is possible and could lead to an expansion upward. But if SOL breaks below $73, he expects a test of recent lows in the coming weeks.

It’s a make or break level for $SOL.
If this level does hold, we’re able to see a quick bounce upwards and that would mean that we’re going to see this expansion upwards.
Failing to do that, breaking <$73 and I’m looking to see a test of the lows happen in the coming weeks.
It… pic.twitter.com/lFq79TPj04
— Michaël van de Poppe (@CryptoMichNL) July 13, 2026
Some charts point to a Wyckoff accumulation structure forming in SOL. Analyst Seth’s chart suggests SOL may have already passed through a long selling phase and is now building a base.
Deeper Correction Still Possible
Analyst Crypto Patel shared a three-week chart showing SOL has fallen from the $240 resistance area and remains below key barriers at $95–$100 and $140.
Few will remember buying $SOL below $70. Everyone will remember chasing it above $240. pic.twitter.com/7oMrynPD9X
— Crypto Patel (@CryptoPatel) July 12, 2026
Patel identifies a long-term accumulation zone between $30 and $52. If Solana corrects further, that zone could offer a low-risk entry for long-term buyers.
For any meaningful recovery, SOL first needs to reclaim the $95–$100 range. Holding above that could build momentum toward $140.
On the network side, Circle minted 250 million USDC on Solana, which Cointelegraph reported as a sign of continued liquidity and activity on the chain.
Some traders are eyeing $150 as a longer-term target, but that level only becomes realistic after SOL clears $80, $90, and $100 in sequence.
SOL is currently holding above a rising trendline on the daily chart, with cloud support between $74 and $77.


Be the first to comment