



STORJ gave back a 60% spike and is down 34% in a day, hours before Upbit delists it, with Storj Labs still in Chapter 11 bankruptcy court.
STORJ traded for six and a half cents on Thursday. By Saturday morning it had printed seven and a half, a level the coin had not touched since spring. Then, inside about eighteen hours, nearly the whole move came right back off, and the token settled under four cents, down 34% on the day.
Storj is not some three week old presale coin. Storj Labs has been building decentralized cloud storage since 2014. The token itself dates back to a 2017 sale that raised roughly $30 million, according to CoinGecko‘s own project page. That history is part of why this chart is worth a second look, not less.
Honestly, eight years of history and a 60% round trip in under a day is not something to wave off as noise.

A Deadline Nobody Priced In
Upbit, the largest exchange in South Korea, posted a delisting notice for STORJ. It takes effect Sunday at 15:00 Korean time, which is tomorrow by the time this runs.
Binance got there first. It pulled STORJ from spot trading back on September 3rd. That came months after Binance tagged the coin with its Monitoring Label back in May, flagging it for roughly this kind of outcome.
Traders who still held size apparently decided the last stretch before a major exchange cuts the cord was worth a shot. Volume on OKX and KuCoin spiked hard into the weekend. Thin order books did the rest, and the coin ran from the high threes to the mid sevens before gravity showed up.
The Squeeze Ran Out Of Room
Whoever bought the spike mostly did not stick around. A coin that traded near eight cents in early September is back trading roughly where it started.
Zoom out on the weekly chart and the bankruptcy filing barely registers against the bigger picture. STORJ is still up over 32% for the week even after today’s drop, purely because of how far the spike ran before it cracked.

STORJ/USDT weekly chart, five year view. Source: TradingView / KuCoin.
STORJ peaked above $3.80 back in March 2021. It has been bleeding for most of the five years since, down more than 98% from that high even after this week’s spike.
STORJ/USDT monthly chart, full history. Source: TradingView / KuCoin.
The Bankruptcy Part Gets Skipped
Here is the piece most of the delisting chatter leaves out. Storj Labs itself filed for Chapter 11 bankruptcy protection back on July 26th, in a West Virginia federal court. The filing dealt with what the company called legacy liabilities from an earlier phase of the business, according to the company’s own blog post.
That post framed the move as a restructuring, not a shutdown. It said the storage network and customer services would keep running through the court process, subject to the usual bankruptcy rules and approvals.
Token holders, per that same post, may eventually get some form of equity in the reorganized company. Might. The terms have not been finalized yet, and creditors get paid first. A crypto token sitting behind creditors in a bankruptcy queue is not a great place to be, worth remembering every time this chart moves.
One Wallet Owns A Quarter Of It
Pull up Storj’s holder data on Etherscan and the picture gets uglier. A single wallet, not tagged as an exchange, holds 24.8% of the entire STORJ supply on its own. That stake alone is worth a little over $4 million at current prices.
The top five wallets combined control just over half the coin. The top 100 wallets hold 87.6% of everything that exists.
Etherscan’s own concentration tool scores the token with a Gini coefficient of 0.9918, about as unequal as a token distribution gets. It flags 23 wallets, just 0.02% of all holders, as controlling 76% of the supply between them. That thin a float means a handful of addresses can move price without much resistance. It lines up uncomfortably well with a 60% spike that evaporated in under a day.
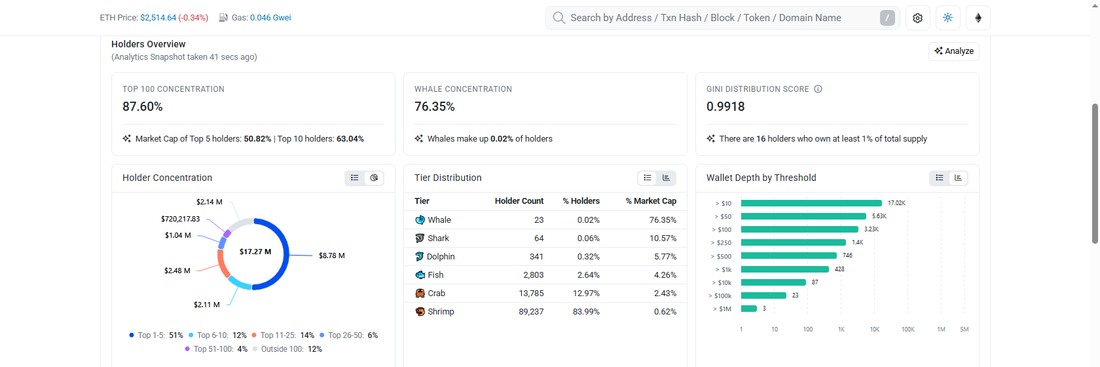
STORJ holder concentration snapshot. Source: Etherscan.
What The Candles Actually Show
On the 30 minute chart, the rally out of the September low looks impulsive. Clean higher highs carried it into a blow off top near $0.075. Then came a sharp break of structure to the downside, erasing the move inside a handful of candles.
STORJ/USDT 30 minute chart, the full spike and dump. Source: TradingView / KuCoin.
The 5 minute chart shows the same shape in finer detail. A fast climb, a choppy top with a lower high, then a decisive break below the launch point of the rally. Volume was already fading well before price actually rolled over.
STORJ/USDT 5 minute chart, intraday structure of the reversal. Source: TradingView / KuCoin.
A Float This Thin Cuts Both Ways
That kind of round trip, fast up and fast back down, reads more like a liquidity grab around a known deadline. The token has 87% of its supply sitting in just 100 wallets. It does not look like the start of a real trend change. Nothing here is investment advice, just a read of the chart and the filings behind it.
STORJ remains a name worth watching inside the wider altcoin market, not as a stand-alone bet. Upbit’s deadline lands before this piece is even a day old.



Be the first to comment