



SUI price is showing signs of consolidation following a prolonged downtrend, as buyers attempt to regain control. Technical indicators suggest that SUI momentum could improve, although the token’s next direction remains uncertain.
At the time of writing, SUI is trading at $0.7452, down 0.64% over the last 24 hours, while its 24-hour trading volume stands at $386.77 million and its market capitalization is around $3.05 billion.
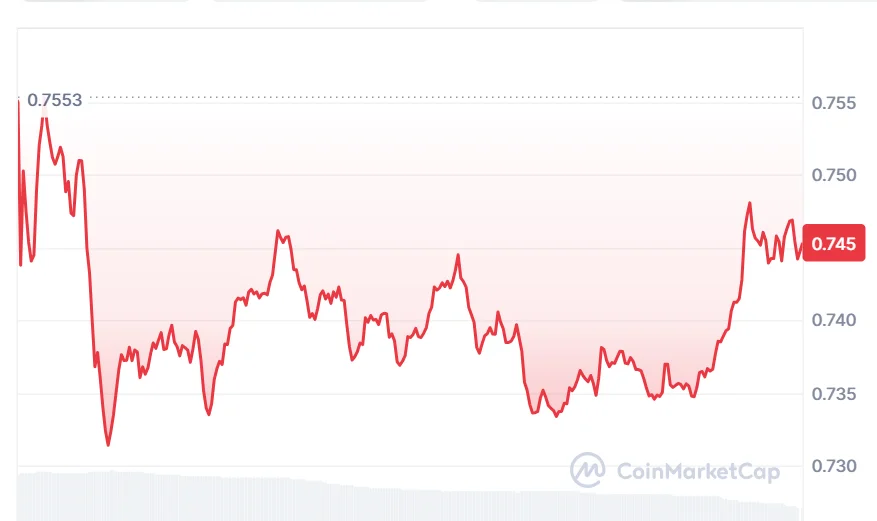
SUI Price Signals Possible Recovery
On August 29, 2026, a crypto analyst, BitGuru, pointed out the present configuration and stated that SUI has been consolidating around $0.73. This particular price point has turned out to be crucial for the token, as holding on to it would allow the bulls to make a comeback effort.
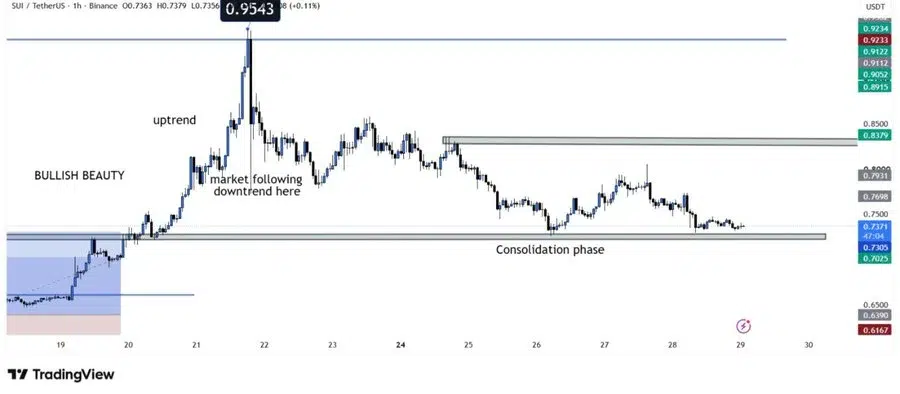
Whether SUI can trade above $0.73 will determine the direction it will take going forward. A sustained defense of this level by buyers will see the crypto test $0.77, and that will give early signals of a return of buying interest.

A break above $0.77 will improve the technical formation and open up a chance for the crypto to head towards higher levels. Failure to trade above $0.73 will see SUI struggle below $0.70.
If selling pressure grows under $0.70, the cryptocurrency may suffer from further price declines due to the revaluation of the recent consolidation.
Also Read | Stablecoins Face New BIS Warning Over Large-Scale Payment Use
SUI Technical Indicators Show Positive Momentum
From the SUI Bollinger Bands chart, we see that the current price is at $0.74661, which is above the middle band at $0.73211. The upper band is at $0.85090, and the lower one is at $0.61332, meaning that SUI has the chance to increase further if buyers push the price up. It could happen if SUI stays above the middle band.
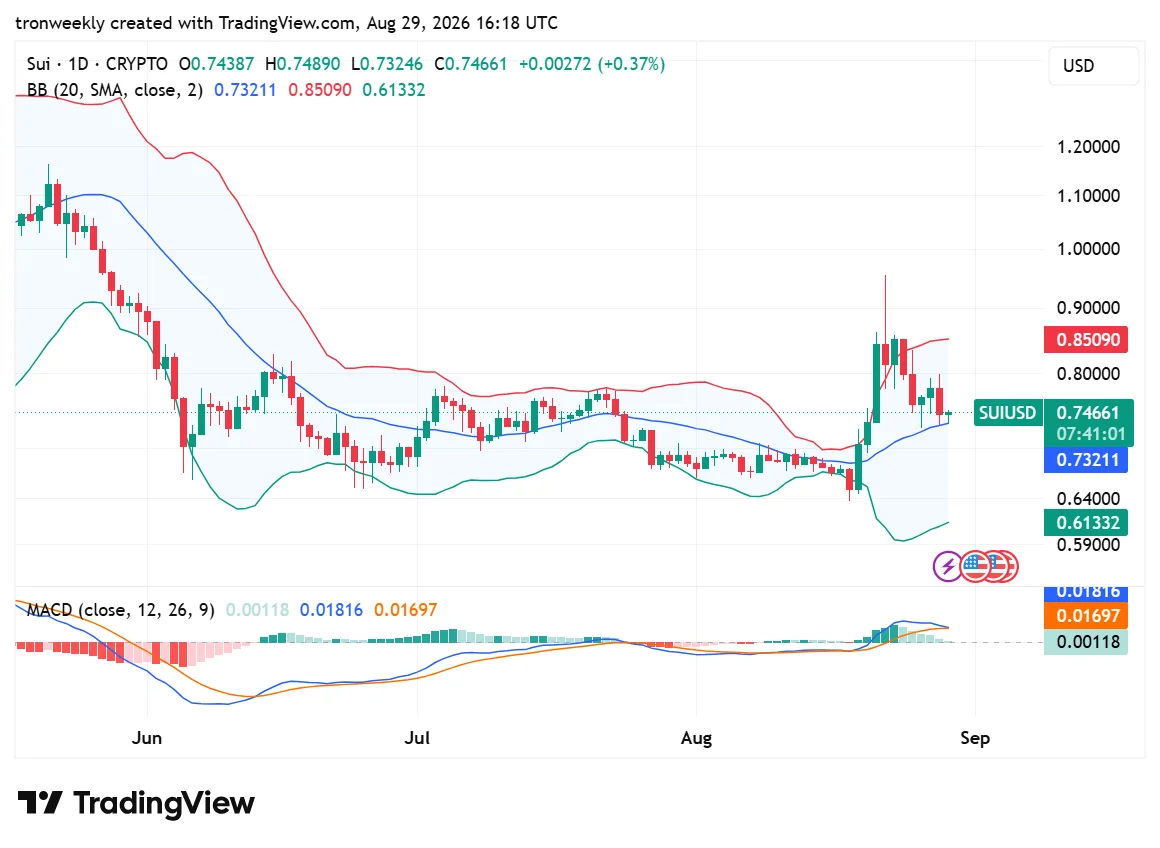
Positive momentum also comes from the MACD indicator, with the MACD line above the signal line – 0.01816 versus 0.01697. The positive histogram shows that buyers dominate, but the small difference between the lines of the indicator could mean the potential weakening of the momentum.
Why the $0.73 Level Matters for SUI
Not only is the significance of $0.73 more than just one technical signal. Following a long downtrend, holding the significant support zone could enable buyers to build a solid base.
While the defense of this price level could indicate to SUI bulls that the pressure from sellers might finally be abating, any move above $0.77 would certainly be more crucial for those looking to see if the price has started recovering.
The alternative scenario is a breakdown below $0.73, which would mean that sellers have the upper hand and $0.70 is the new target.
What Happens Next for SUI Price?
The next key battleground for SUI price might be the area between $0.73 and $0.77 support/resistance levels.
The continuation of the upward movement will require the coin to stay above $0.73 and break the $0.77 level. In this case, $0.85 could act as a significant level due to the current Bollinger Bands setup.
However, the breakdown below $0.73 will put downward pressure on the bulls’ setup and push the price down towards $0.70 or even lower.
Currently, there are no signals that SUI price is reversing its previous trends. Positive MACD and price above the Bollinger middle band look promising, but the buyers have to work hard to take the asset above the current resistance level.
Also Read | Trump Digital Gold Token Crashes 99% After X Promotion
This article contains market analysis and price predictions. These are not guarantees. Crypto markets are volatile. Always DYOR. Not financial advice.



Be the first to comment